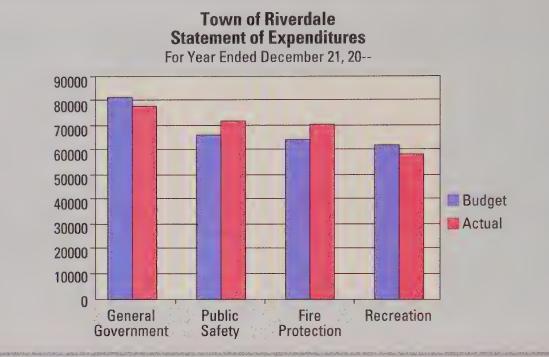
The town of Riverdale prepared a graph charting the budgeted and actual expenditures for each of its
Question:
The town of Riverdale prepared a graph charting the budgeted and actual expenditures for each of its four departments.
Instructions:
Analyze the graph to answer the following questions.
1. Which departments showed favorable variances regarding their expenditures?
2. Which departments showed unfavorable variances regarding their expenditures?
3. Which department had the largest budget for expenditures? Approximately how much?
Step by Step Answer:
Related Book For 

Question Posted:


