The following data represent the product concentrations versus time during the initial stages of pseudo-first-order reactions with
Question:
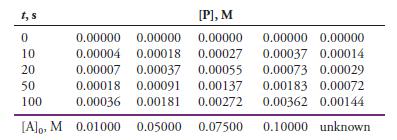
The following data represent the product concentrations versus time during the initial stages of pseudo-first-order reactions with different initial concentrations of analyte [A]0:

For each concentration of analyte, find the average initial reaction rate for the five time slots given. Plot the initial rate versus the concentration of analyte. Obtain the least-squares slope and intercept of the plot and determine the unknown concentration.
Fantastic news! We've Found the answer you've been seeking!
Step by Step Answer:
Related Book For 

Fundamentals Of Analytical Chemistry
ISBN: 9780357450390
10th Edition
Authors: Douglas A. Skoog, Donald M. West, F. James Holler, Stanley R. Crouch
Question Posted:


