

Shewhart chart of continuous data. A critical contaminant is regularly monitored on a run chart during continuous
Question:
Shewhart chart of continuous data. A critical contaminant is regularly monitored on a run chart during continuous production of a chemical. Samples are selected three times (at somewhat regular intervals) during each eight-hour shift. The process engineer wanted to plan a study to evaluate some modifications to the process. She obtained the following data during the last week:
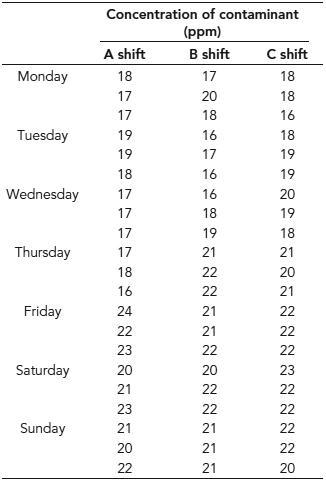
(a) Develop a Shewhart chart for these data. How should the data be subgrouped?
(b) Was the process stable during this week?
(c) Plan an experiment to study a modification to one of the raw materials used in this process.
Fantastic news! We've Found the answer you've been seeking!
Step by Step Answer:

Answered By
PRINCE PANDEY
I am Indian Chartered Accounting having a strong hold in the subjects of Accounting, IFRS Reporting, Indian
Taxation, Cost Accounting, Auditing. I have vast experience of teaching a student with easy way problem-solving approach.
1+ Reviews
10+ Question Solved
Related Book For 
Quality Improvement Through Planned Experimentation 3/E
ISBN: 978-0071759663
3rd Edition
Authors: Ronald Moen ,Thomas W Nolan ,Lloyd P Provost
Question Posted:
