

In Chapter 13, Exercise 13 studied the relationship between the level of violence in a comic book
Question:
In Chapter 13, Exercise 13 studied the relationship between the level of violence in a comic book and how humorous the comic book is rated by a sample of women:
\[\begin{aligned} & \text { Level of violence }(X) \text { : Range }=1-7, \bar{X}_{i}=4.30, s_{X}=2.21 \\ & \text { Humorous rating }(Y) \text { : Range }=1-6, \bar{Y}=3.50, s_{Y}=1.58 \text { Correlation: } r=-.78 \end{aligned}\]
a. Calculate the linear regression equation predicting humorous ratings from level of violence and draw it into a scatterplot.
b. What humorous rating would you predict for a comic book with a level of violence of 4?
Chapter 13, Exercise 13
Earlier in this chapter, we discussed a study that examined the relationship between the amount of time students take to complete a test and their scores on the test (Herman, 1997). The two variables in this study were Time (the number of minutes taken by each student to finish the examination) and Exam score (the number of correct answers for each student, ranging from 0 to 100). The researcher in this study wished to test the hypothesis that the more time students take to finish an exam, the lower their score on the exam. In other words, there is a negative relationship between Time and Exam score. The data for the 32 students in this study are listed below (note that the scatterplot and descriptive statistics for this data were provided earlier in this chapter):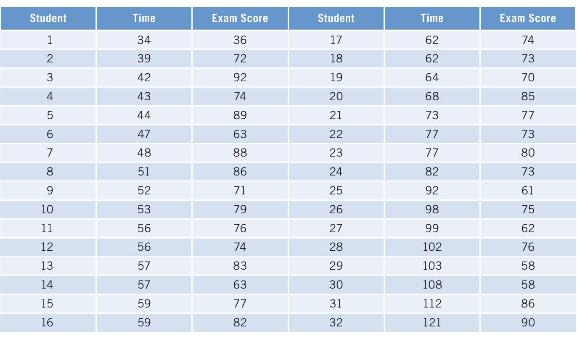
Step by Step Answer:

This question has not been answered yet.
You can Ask your question!

Fundamental Statistics For The Social And Behavioral Sciences
ISBN: 9781506377476
2nd Edition
Authors: Howard T Tokunaga
