

Question: Figure 6.5 shows the input and output data for a predictive deconvolution. Explain the origin of the extra events in the output panel. What will
Figure 6.5 shows the input and output data for a predictive deconvolution. Explain the origin of the extra events in the output panel. What will happen if random noise is added in the input?
Figure 6.5
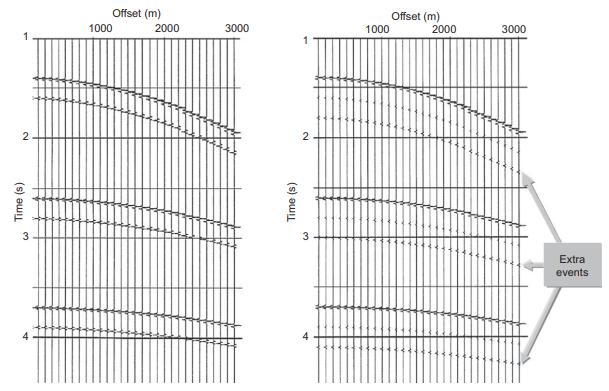
Time (s) 3 2 1000 Offset (m) 2000 3000 1000 Time (s) 2 Offset (m) 2000 3000 3 Extra events
Step by Step Solution
★★★★★
3.48 Rating (141 Votes )
There are 3 Steps involved in it
1 Expert Approved Answer
Step: 1 Unlock

Question Has Been Solved by an Expert!
Get step-by-step solutions from verified subject matter experts
Step: 2 Unlock
Step: 3 Unlock