10. The accompanying table illustrates annual salaries and income tax owed by five individuals. Apart from the...
Question:
10. The accompanying table illustrates annual salaries and income tax owed by five individuals. Apart from the fact that they receive different salaries and owe different amounts of income tax, these five individuals are otherwise identical.
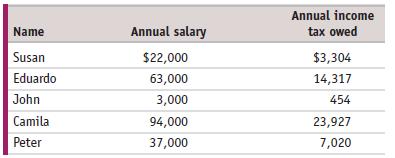
a. If you were to plot these points on a graph, what would be the average slope of the curve between the points for Eduardo’s and Camila’s salaries and taxes using the arc method? How would you interpret this value for slope?
b. What is the average slope of the curve between the points for John’s and Susan’s salaries and taxes using the arc method? How would you interpret that value for slope?
c. What happens to the slope as salary increases? What does this relationship imply about how the level of income taxes affects a person’s incentive to earn a higher salary?
Step by Step Answer:

This question has not been answered yet.
You can Ask your question!