

1.3. The table below shows the components of M1 and M2 in billions of dollars for the...
Question:
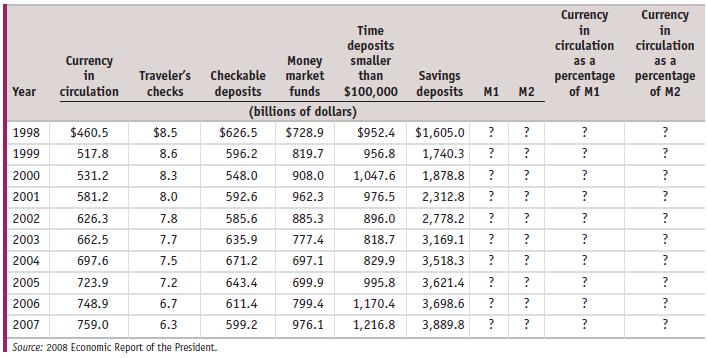
1.3. The table below shows the components of M1 and M2 in billions of dollars for the month of December in the years 1998 to 2007 as published in the 2008 Economic Report of the President. Complete the table by calculating M1, M2, currency in circulation as a percentage of M1, and currency in circulation as a percentage of M2. What trends or patterns about M1, M2, currency in circulation as a percentage of M1, and currency in circulation as a percentage of M2 do you see?
What might account for these trends?
Fantastic news! We've Found the answer you've been seeking!
Step by Step Answer:

Answered By
PALASH JHANWAR
I am a Chartered Accountant with AIR 45 in CA - IPCC. I am a Merit Holder ( B.Com ). The following is my educational details.
PLEASE ACCESS MY RESUME FROM THE FOLLOWING LINK: https://drive.google.com/file/d/1hYR1uch-ff6MRC_cDB07K6VqY9kQ3SFL/view?usp=sharing
3+ Reviews
10+ Question Solved
Related Book For 

Question Posted:
