7. The accompanying table shows the relationship between workers hours of work per week and their hourly
Question:
7. The accompanying table shows the relationship between workers’
hours of work per week and their hourly wage rate. Apart from the fact that they receive a different hourly wage rate and work different hours, these five workers are otherwise identical.
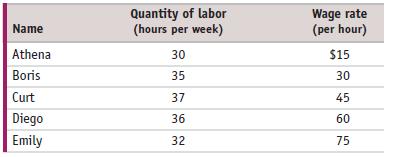
a. Which variable is the independent variable? Which is the dependent variable?
b. Draw a scatter diagram illustrating this relationship. Draw a (nonlinear) curve that connects the points. Put the hourly wage rate on the vertical axis.
c. As the wage rate increases from $15 to $30, how does the number of hours worked respond according to the relationship depicted here? What is the average slope of the curve between Athena’s and Boris’s data points using the arc method?
d. As the wage rate increases from $60 to $75, how does the number of hours worked respond according to the relationship depicted here? What is the average slope of the curve between Diego’s and Emily’s data points using the arc method?
Step by Step Answer:

This question has not been answered yet.
You can Ask your question!