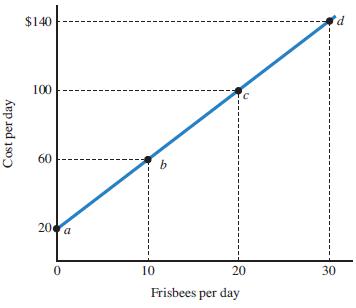
The following graph shows the relationship between the number of Frisbees produced and the cost of production.
Question:
The following graph shows the relationship between the number of Frisbees produced and the cost of production. The vertical intercept is $____________, and the slope of the curve is $ _______ per Frisbee.
Point b shows that the cost of producing____________ Frisbees is $____________. The cost of producing 15 Frisbees is $____________.

Fantastic news! We've Found the answer you've been seeking!
Step by Step Answer:
Related Book For 

Macroeconomics Principles Applications And Tools
ISBN: 123885
8th Edition
Authors: Arthur OSullivan ,Steven Sheffrin ,Stephen Perez
Question Posted:


