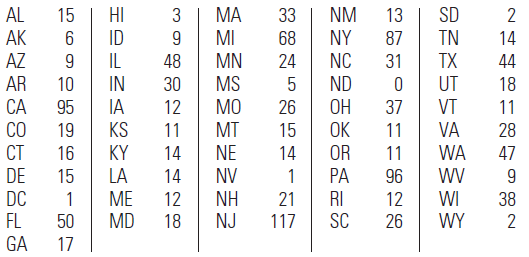
How safe is your neighborhood? Are there any hazardous waste sites nearby? The table shows the number
Question:

a. What variable is being measured? Is the variable discrete or continuous?
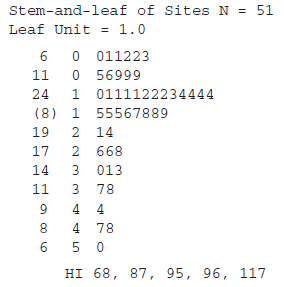
b. A stem and leaf plot generated by MINITAB is shown here. Describe the shape of the data distribution. Identify the unusually large measurements marked €œHI€ by state.
c. Can you think of any reason these five states would have a large number of hazardous waste sites? What other variable might you measure

Fantastic news! We've Found the answer you've been seeking!
Step by Step Answer:
Related Book For 

Introduction To Probability And Statistics
ISBN: 9780495389538
13th Edition
Authors: William Mendenhall, Robert J. Beaver, Barbara M. Beaver
Question Posted:


