All Matches
Solution Library
Expert Answer
Textbooks
Search Textbook questions, tutors and Books
Oops, something went wrong!
Change your search query and then try again
Toggle navigation
FREE Trial
S
Books
FREE
Tutors
Study Help
Expert Questions
Accounting
General Management
Mathematics
Finance
Organizational Behaviour
Law
Physics
Operating System
Management Leadership
Sociology
Programming
Marketing
Database
Computer Network
Economics
Textbooks Solutions
Accounting
Managerial Accounting
Management Leadership
Cost Accounting
Statistics
Business Law
Corporate Finance
Finance
Economics
Auditing
Hire a Tutor
AI Tutor
New
Search
Search
Sign In
Register
study help
mathematics
introductory statistics behavioral
Questions and Answers of
Introductory Statistics Behavioral
State the research question.Is hand span a good predictor of how much candy you can grab? Using 45 college students as subjects, researchers set out to explore whether a linear relationship exists
Read FAQ 10.5.1. Explain intuitively why conducting tests when you assume the relationship is linear is more powerful than if you have no linear assumption.
Researchers in a clinical study collected information from their subjects at the beginning of the study. Two of the variables were body mass index (BMI) and age. We are interested in seeing if there
In a survey of statistics students at Hope College, two of the questions asked were their weight (in pounds) and the cost of their last haircut, including any hair treatments (in dollars). Th e data
The data in the file UsedHondaCivics come from a sample of used Honda Civics listed for sale online in July 2006. The variables recorded are the car’s age (calculated as 2006 minus year of
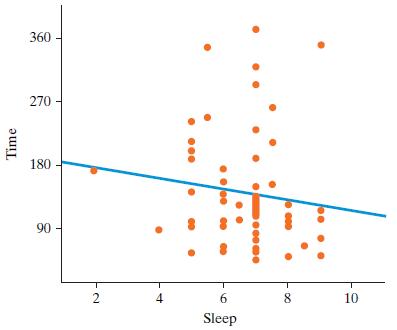
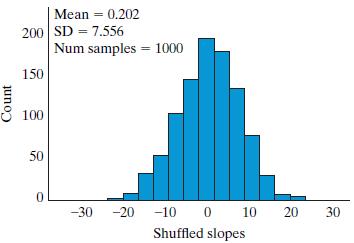
Reconsider the previous exercise about the amount of sleep (in hours) obtained in the previous night and time to complete a paper and pencil maze (in seconds). Th e equation of the least squares
The data in the file UsedHondaCivics come from a sample of used Honda Civics listed for sale online in July 2006. Th e variables recorded are age (calculated as 2006 minus year of manufacture) and
Th e data in the file UsedHondaCivics come from a sample of used Honda Civics listed for sale online in July 2006. Th e variables recorded are age (calculated as 2006 minus year of manufacture) and
Reconsider the previous two exercises. Answer the questions with regard to the intercept coefficient rather than the slope coefficient.Reconsider the previous two exercisesReconsider the previous
State the null and alternative hypotheses to be investigated with this study. (You may use the symbol ???? to represent these parameters.)
What are the observational/experimental units?
State the research question.
Read FAQ 9.2.2 and answer the following questions:a. What does the numerator in the F-statistic measure?b. What does the denominator measure?c. If the population group means are different, then the
Read FAQ 9.2.2 and answer the following questions: Compare the two test statistics Max − Min and F:a. Which one(s) are standardized?b. Which one(s) have a theory-based approximation?c. Which one
Read FAQ 9.2.1 and answer the following questions: If you can use the F-test for two or more samples, why bother to learn the t-test? Why not just rely on F?
Read FAQ 9.2.1 and answer the following question: Why is it important to learn about the F-statistics instead of just relying on the two-sample t-test? Give two reasons.
Reconsider the previous exercise of the study of the Hatha yoga, walking exercise, and wait-list control. Another outcome of interest was change in number of words correctly recalled from a list aft
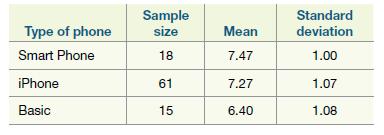
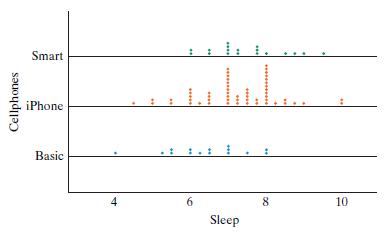
Statistics students were surveyed and two of the questions they were asked was what type of cellphone they use (Basic, iPhone, Smart Phone that is not an iPhone) and how much sleep they typically get
Are you able to conclude that the cause of any differences was due to the class status of the driver? Explain.
Are the validity conditions met so we can perform follow-up analysis (pairwise comparisons) using theory-based techniques? Explain.
State the research question.Researchers from the University of California, Berkeley wondered whether upper-class individuals behave more unethically than lower-class individuals. To further
Read FAQ 8.2.1 and answer the following: True or false? When comparing more than two groups on a categorical response, the choice of statistic (p̂max – p̂min, MAD, and chi-square) doesn’t
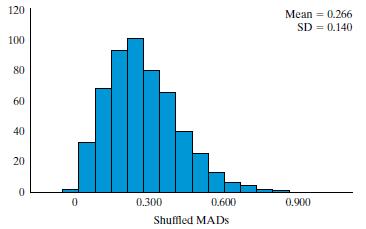
In Exploration 8.1 you used the MAD statistic to evaluate the strength of evidence for association between the way a question was asked and whether or not someone chose to be an organ donor.a.
In Example 8.1 you used the MAD statistic to evaluate the strength of evidence for association between the order in which a car arrived at an intersection and whether or not it came to a complete
Consider the MAD statistic. What would happen if you did not take absolute values before calculating the sum of differences between group proportions? Why would this not be a useful calculation
Carry out an appropriate test of significance to see whether on average there is a difference in the E. coli counts between filters with more than 2 inches of sand and those with less. Report your
In a study of parents’ perceptions of their children’s size, researchers Kaufman etal. (Current Biology, 2013) asked parents to estimate their youngest child’s height. The researchers
Reconsider the previous exercise on memorization with and without a delay. If you haven’t already done so, put the data file MemorizationDelay into the Matched Pairs applet and do at least 1,000
Students wanted to see if chewing gum would help people memorize words from a given list of 25 words compared to trying to memorize words when not chewing gum.a. Suppose you had 20 subjects
Which of the following is an example of a paired design?A. A teacher taught one class a lesson using technology and another class without technology. Their scores on a quiz were then compared.B. A
Reconsider the previous exercise. Determine a 95% confidence interval for comparing the population mean drive through times between the two fast food restaurants. Also interpret what this interval
Read FAQ 6.2.3 and answer the following question: True or false, in a blind study, the subjects do not know which treatment they are receiving.
Read FAQ 6.2.1 and answer the following question: True or false, the parameter is fixed and unknown, while the statistic is the parameter plus a random error.
With randomization techniques we are able to analyze any statistic we desire. What if we wanted to look at whether the median lifespan of men with children was higher than men without children? Using
Reconsider the previous exercises about the study of whether there is an association between number of Facebook friends and a person’s sex. The p-value for the randomization-based test of whether
Students collect the time (in seconds) for men and women to use the restroom at a mall in Michigan. The results are shown in the 6.1.23 histograms.a. One data set (male or female) has both the larger
In a survey of introductory statistics students, an instructor asked students to report how many hours they had spent studying in a typical week during the last term and their sex. Th e data appears
State the research question.
Read FAQ 5.3.1 and answer the following questions.a. When we conduct a simulation using cards, why is it that we like to fix the color of the cards (like having 17 of one color and 13 of another) and
Recall the data from the Physicians’ Health Study: Of the 11,034 physicians who took the placebo, 138 developed ulcers during the study. Of the 11,037 physicians who took aspirin, 169 developed
Recall the data from the Physicians’ Health Study: Of the 11,034 physicians who took the placebo, 189 suffered heart attacks during the study. Of the 11,037 physicians who took aspirin, 104 had
Reconsider the data from the previous exercise about investigating whether there is a relationship between undergoing surgery and whether a man dies due to prostate cancer related reasons.a. Which of
In a randomized, double-blind study reported in the Journal of American Medical Association, researchers Waber et al. (2008) administered a pill to each of 82 healthy paid volunteers from Boston,
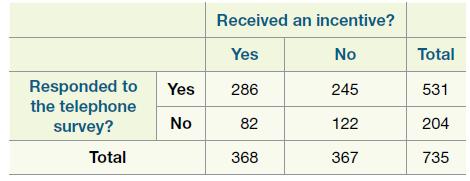
A team of researchers (Singer etal., 2000) used the Survey of Consumer Attitudes to investigate whether incentives would improve the response rates on telephone surveys. A national sample of 735
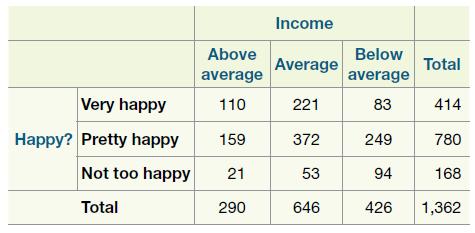
To investigate whether there is an association between happiness and income level, we will use data from the 2002 General Social Survey (GSS), cross-classifying a person’s perceived happiness with
Do men with children tend to live longer than men without children? To investigate, a group of students at Cal Poly randomly sampled men from the obituaries page on the San Luis Obispo Tribune’s
Studies have shown that children in the U.S. who have been spanked have a signifi cantly lower IQ score on average than children who have not been spanked.a. Identify the explanatory variable in
Read FAQ 3.4.1 and then answer the following question.To cut the margin of error of a confidence interval in half one mustA. Increase the sample size by a factor of 2B. Increase the ample size by a
Read FAQ 3.4.1 and then answer the following question. True or false? The standard error formulas for x̅ and p̂ both have √n in the denominator.
Which confidence interval would be the narrowest?A. 99%B. 95%C. 90% D. 85%
Read FAQ 3.3.1 and then answer the following question.Which method can only construct a 95% confidence interval?A. Range of plausible valuesB. 2 SDC. Th eory-based one-proportion z-interval
Read FAQ 3.3.1 and then answer the following question.Describe three different methods for constructing a confidence interval for a population proportion.
Read FAQ 3.2.1 and then answer the following question.True or False? For 95% confidence intervals constructed from repeated samples from the same population, 95% of the intervals contain the
Read FAQ 3.2.1 and then answer the following question.True or False? Th ere is a 95% chance that the parameter is contained in a 95% confidence interval.
Read FAQ 3.2.1 and then answer the following question.Match confidence interval terminology to the game of horseshoes.A. ParameterB. Confidence interval C. Coverage probability 1.
Read FAQ 3.1.1 and then answer the following question.True or false? A confidence interval informs on all parameter values that are plausible, the
Read FAQ 3.1.1 and then answer the following question.True or false? You can find the strength of evidence of a test by looking at the confidence interval.
Read FAQ 3.1.1 and then answer the following question. Reporting a confidence interval is more informative than a test of significance.A. Always.B. Only if you are concerned with a reject or fail to
Use the One Proportion applet to simulate 1,000 repetitions of a random process, assuming that the proportion of cell phone users who fake calls is 0.10. Report what values you input into the applet.
Read FAQ 2.3.1 and answer the following question. Explain, as if to someone who doesn’t know much about statistics, why it’s dangerous to reach dramatically different conclusions for p-values of
Reconsider Example 1.4 about whether winners of elections can be predicted better than random chance simply by considering the faces of the candidates.a. Describe what Type I error means in this
Later in the book you will encounter many hypotheses of the following type:H0: New treatment is no better than current treatment.Ha: New treatment is better than current treatment.a. Describe what
A researcher decides to set the significance level to 0.001.a. If the null hypothesis is true, what is the probability of a Type I error?b. If the researcher chooses a larger significance level, what
A researcher decides to set the signifi cance level to 0.001.a. If the null hypothesis is true, what is the probability of a Type I error?b. If the researcher chooses a larger significance level,
Suppose that you perform a significance test and, based on the p-value, decide to reject the null hypothesis at the α = 0.05 significance level. Th en suppose that your colleague decides to conduct
Read FAQ 2.2.2 and answer the following question. In your own words, explain the concept of degrees of freedom as it relates to t-distributions, including discussion of how a t-distribution begins to
Read FAQ 2.2.1 and answer the following question. In your own words, explain why (mean − median)/SD is a good measure of skewness.
Reconsider Dr. Sameer’s research question about how much time Cal Poly students spend on watching television. Suppose that Dr. Sameer surveys a random sample of 100 Cal Poly students, and for this
a. Suppose that an instructor decides to add five points to every student’s exam score in a class. What effect would this have on the mean exam score for the class? On the median exam score? What
Reconsider the previous exercise where the monthly salaries of the three people working in a small firm are $3500, $4000, and $4500. If instead of a $100 raise, everyone gets a 10% raise, how, if at
Reconsider the previous exercise. The monthly salaries of the three people working in a small firm are $3,500, 4,000, and $4,500. Suppose the firm makes a profit and everyone gets a $100 raise. How,
Reconsider the previous exercise. Th e monthly salaries of the three people working in a small firm are $3,500, 4,000, and $4,500. Suppose the firm makes a profit and everyone gets a $100 raise. How,
Read FAQ 2.1.2 and answer the following question.Referring to Example 1.1 about Doris and Buzz, explain where randomization occurs in your chance model but may not be truly random chance in the study.
Read FAQ 2.1.2 and answer the following question. Referring to Example 1.1. about Doris and Buzz, explain where randomization could come into play in the study design.
Read FAQ 2.1.1 and answer the following question. True or false? Increasing the sample size n, always helps improve the bias in the sample. Explain.
Read FAQ 2.1.1 and answer the following question. Explain, as if to someone who doesn’t know statistics, why taking a random sample of only 1500 people from a very large population is
In the previous exercise, explain whether or not you believe the sample is representative of the population of interest and why.Previous exerciseIdentify each of the following by describing it or
Identify each of the following by describing it or stating its value (where possible).a. Population of interestb. Samplec. Parameter of interestd. Statistic
Evaluate the strength of evidence for the hypotheses in the previous question.a. Find the p-value for the hypotheses in the previous question using a simulation-based approach.b. Based on the p-value
Use the previous information to answer the following questions.a. What is the population of interest?b. Do you believe that the proportion of people unhappy with the verdict in the sample is likely
Evaluate the strength of evidence for the hypotheses in the previous question.a. Find the p-value for the hypotheses in the previous question using a simulation-based approach.b. Based on the p-value
Use the previous information to answer the following questions.a. What is the population of interest?b. Do you believe that the proportion of likely voters for the incumbent in the sample is likely
Use the previous information to answer the following questions.a What is the population of interest?b. Do you believe that the average hours of television per day in the sample is likely less than,
Argue whether or not you believe using a sample of students from your school’s cafeteria (you recruit the next 100 people to visit the cafeteria to participate) may or may not yield biased
State the appropriate null and alternative hypotheses to be tested.
What are the observational units?
Think of a random process of interest to you for which you would be interested in assessing evidence regarding a claim about the value of the long-run proportion associated with the random process.a.
Read FAQ 1.4.1 about two-sided alternative hypotheses and answer the following questions.a. Why don’t we first take a sample and use the observed sample proportion to help us decide which direction
a. Define the parameter of interest in the context of the study and assign a symbol to it.b. State the null hypothesis and the alternative hypothesis using the symbol defined in part (a).c. What is
Read FAQ 1.2.2 that explores how small a p-value needs to be in order for us to have strong evidence against the null hypothesis and answer the following questions.a. What does Persi Diaconis claim
Read FAQ 1.2.1 that describes why we need to include “or more extreme” when computing a p-value and, in your own words, describe why we don’t just compute the p-value based on the probability
Recall that one of the authors liked to play the game Minesweeper (Exercise 1.1.8) and she won 12 of the last 20 games she played. Now that you know how to calculate p-values, use an applet to find
a. Identify the observational units and variable in this study. Also classify the variable as categorical or quantitative.b. State the appropriate null and alternative hypotheses (in words) for
Read FAQ 1.1.1 that describes a random process and answer the following questions.a. Buzz’s section on which button to push can be thought of as a random process as long as we make what two
a. Describe the relevant long-run proportion of interest in words.b. What statistical term is given to the long-run proportion you described in (a)?c. What value does the chance model assert for the
a
The following table gives the average weekly retail price of a gallon of regular gasoline in the eastern United States over a 9-week period from December 1, 2014, through January 26, 2015. Consider
The CTO Corporation has a large number of chain restaurants throughout the United States. The research department at the company wanted to find if the restaurants’ sales depend on the mean income
Showing 1 - 100
of 379
1
2
3
4