Statistics students were surveyed and two of the questions they were asked was what type of cellphone
Question:
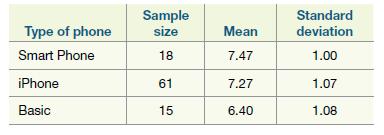
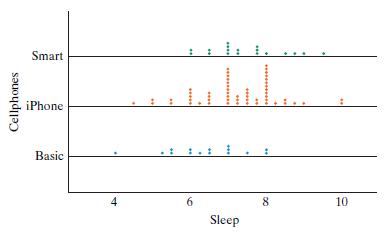
Statistics students were surveyed and two of the questions they were asked was what type of cellphone they use (Basic, iPhone, Smart Phone that is not an iPhone) and how much sleep they typically get on a school night in hours to see if there is an association between sleep and type of phone. For the purposes of this exercise, we will consider this sample to be representative of all students at the school. The summary statistics are shown in the following table and the data are shown in the dotplots.


a. Identify the explanatory variable and the response variable in this study.
b. State, in words or symbols, the null and alternative hypotheses.
c. Using the summary statistics given, compute the MAD statistic.

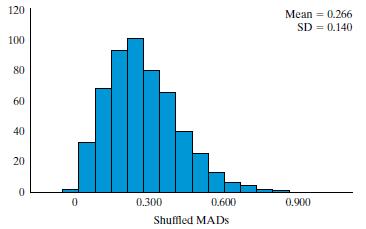
d. A null distribution for this study is shown above. Using the MAD statistic you calculated in part (c), will the p value for this test be large or small? Explain.
e. Does it appear there is an association between type of cell phone used and the amount of sleep students get? If so, can you conclude that the type of cellphone being used is causing the difference in sleep times?
Step by Step Answer:

Introduction To Statistical Investigations
ISBN: 9781118172148
1st Edition
Authors: Beth L.Chance, George W.Cobb, Allan J.Rossman Nathan Tintle, Todd Swanson Soma Roy


