

Question: Reconsider the previous two exercises. Students at Cal Poly collected data from their classmates and produced the following two-way table of counts: a. Produce a
Reconsider the previous two exercises. Students at Cal Poly collected data from their classmates and produced the following two-way table of counts:
a. Produce a segmented bar graph to display these data. Comment on what the graph reveals.
b. Perform a simulation-based analysis using the chi-square statistic. Submit a screen capture of the simulated null distribution and report the approximate p-value.
c. Based on the approximate p-value from the simulation analysis, would you conclude (at the 0.05 significance level) that there is an association between sex and coffee consumption?
d. Summarize your conclusions from this analysis.
Data from previous exercise
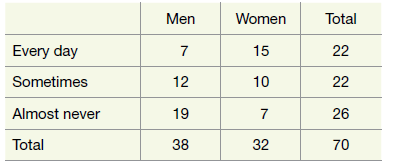
Reconsider the previous exercise about sex and coffee consumption. The sample data could be organized in a two-way table as follows:
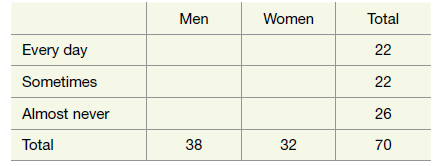
Men Women Total Every day 15 22 Sometimes 12 10 22 Almost never 19 26 Total 38 32 70 Men Women Total Every day 22 Sometimes 22 Almost never 26 Total 38 32 70 70
Step by Step Solution
3.37 Rating (156 Votes )
There are 3 Steps involved in it
a The graph reveals a strong association between sex and coffee ... View full answer

Get step-by-step solutions from verified subject matter experts