

Question: The following segmented bar graph was produced from data collected in the 2010 General Social Survey with regard to the question Can people be trusted?
The following segmented bar graph was produced from data collected in the 2010 General Social Survey with regard to the question €œCan people be trusted?€
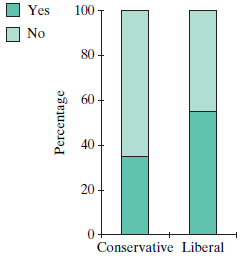
a. About what proportion of the liberals responded that people can be trusted?
b. About what proportion of the conservatives responded that people can be trusted?
c. Does the graph provide any information about what proportion of respondents were liberals?
d. Does the graph suggest that there is a relationship between political leanings and trust? Explain.
Yes 100 No 80 60 40 Conservative Liberal Percentage 20
Step by Step Solution
3.48 Rating (178 Votes )
There are 3 Steps involved in it
a 52 b 35 ... View full answer

Get step-by-step solutions from verified subject matter experts