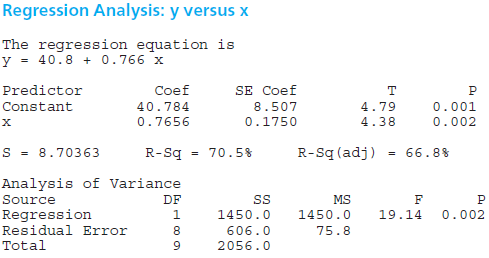
The MINITAB printout for the data in Table 12.1 is shown below. MINITAB output for Exercise 12.78.
Question:
The MINITAB printout for the data in Table 12.1 is shown below.
MINITAB output for Exercise 12.78.

a. Use the Method of Least Squares applet to find the values of a and b that determine the best fitting line, ŷ a bx. When you think that you have minimized SSE, click the button and see how well you did. What is the equation of the line? Does it match the regression equation given in the MINITAB printout?
b. Find the values of SSE and r2 on the Method of Least Squares applet. Find these values on the MINITAB printout and confirm that they are the same.
c. Use the values of b and its standard error SE(b) from the MINITAB printout along with the t-Test for the Slope applet to verify the value of the t statistic and its p-value, given in the printout.
Step by Step Answer:

Introduction To Probability And Statistics
ISBN: 9780495389538
13th Edition
Authors: William Mendenhall, Robert J. Beaver, Barbara M. Beaver


