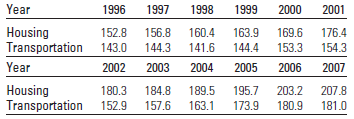
The price of living in the United States has increased dramatically in the past decade, as demonstrated
Question:

a. Create side-by-side comparative bar charts to describe the CPIs over time.
b. Draw two line charts on the same set of axes to describe the CPIs over time.
c. What conclusions can you draw using the two graphs in parts a and b? Which is the most effective?
Fantastic news! We've Found the answer you've been seeking!
Step by Step Answer:
Related Book For 

Introduction To Probability And Statistics
ISBN: 9780495389538
13th Edition
Authors: William Mendenhall, Robert J. Beaver, Barbara M. Beaver
Question Posted:


