All Matches
Solution Library
Expert Answer
Textbooks
Search Textbook questions, tutors and Books
Oops, something went wrong!
Change your search query and then try again
Toggle navigation
FREE Trial
S
Books
FREE
Tutors
Study Help
Expert Questions
Accounting
General Management
Mathematics
Finance
Organizational Behaviour
Law
Physics
Operating System
Management Leadership
Sociology
Programming
Marketing
Database
Computer Network
Economics
Textbooks Solutions
Accounting
Managerial Accounting
Management Leadership
Cost Accounting
Statistics
Business Law
Corporate Finance
Finance
Economics
Auditing
Hire a Tutor
AI Tutor
New
Search
Search
Sign In
Register
study help
mathematics
basic business statistics
Questions and Answers of
Basic Business Statistics
Referring to the results of Problems 9.76 through 9.78 concerning Boston and Vermont shingles, write a report that evaluates the moisture level, weight, and granule loss of the two types of shingles.
One theory about the daily changes in the closing price of a stock is that these changes follow a random walk—that is, these daily events are independent of each other and move upward or downward
Cross-classify each student in the class by gender (male, female) and current employment status (yes, no), so that the instructor can tally the results.a. Construct a table with either row or column
Have each student in the class respond to the question “Which carbonated soft drink do you most prefer?” so that the instructor can tally the results into a summary table.a. Convert the data to
Professor Deanna Oxender Burgess of Florida Gulf Coast University conducted research on annual reports of corporations (see D. Rosato, “Worried About the Numbers? How About the Charts?” New York
Bring to class a chart from a website, newspaper, or magazine published this month that you believe to be a poorly drawn representation of a categorical variable. Be prepared to submit the chart to
Bring to class a chart from a website, newspaper, or magazine published recently that you believe to be a poorly drawn representation of a numerical variable. Be prepared to submit the chart to the
Visit the website of the Gallup organization at www.gallup.com. Read today’s top story. What type of data source is the top story based on?
In Problem 14.3 on page 541, you predicted nonprofit charitable commitment, based on nonprofit revenue and fundraising efficiency. The regression analysis resulted in this ANOVA table:Determine
A financial analyst engaged in business valuation obtained financial data on 60 drug companies (Industry Group SIC 3 code: 283).The file BusinessValuation contains the following
Human resource managers face the business problem of assessing the impact of factors on full-time job growth. A human resource manager is interested in the impact of full-time voluntary turnover and
A nonprofit analyst seeks to determine which variables should be used to predict nonprofit charitable commitment, a nonprofit organization commitment to its charitable purpose. Two independent
In Problems 13.8, 13.20, 13.30, 13.46, 13.62, 13.82, and 13.83, you developed regression models to predict franchise value of major league baseball, NBA basketball, and soccer teams. Now, write a
The file MobileSpeed contains the overall download and upload speeds in mbps for nine carriers in the United States.Source: Data extracted from “Best Mobile Network 2016,” bit.ly/1KGPrMm,
In Problem 9.18, how many degrees of freedom does the t test have?In Problem 9.18If, in a sample of n = 16 selected from a normal population, X̅ = 56 and S = 12, what is the value of tSTAT if you
Why should you use utilities instead of payoffs in certain circumstances?
What is the difference between a risk averter and a risk seeker?
How is Bayes’ theorem used to revise probabilities in light of sample information?
How does the expected value of perfect information differ from the expected profit under certainty?
Why can’t an opportunity loss be negative?
How are opportunity losses computed from payoffs?
What are the advantages and disadvantages of a payoff table as compared to a decision tree?
What is the difference between an event and an alternative course of action?
Refer to Problems 20.3–20.5 and 20.12–20.14, respectively. In which problems do you think the expected monetary value (risk-neutral) criterion is inappropriate? Why?
Do you consider yourself a risk seeker, a risk averter, or a risk-neutral person? Explain.
A vendor at a local baseball stadium must determine whether to sell ice cream or soft drinks at today’s game. The vendor believes that the profit made will depend on the weather. The payoff table
The following are the returns ($) for two stocks:Which stock would you choose and why? A Expected monetary value Standard deviation 20 10
The following are the returns ($) for two stocks:Which stock would you choose and why? Expected monetary value Standard deviation 90 10 10
An entrepreneur is planning to market a new brand of bottled unsweetened, organic iced tea. The profit on each bottle of iced tea to be sold has been set at $0.50. The entrepreneur needs to decide on
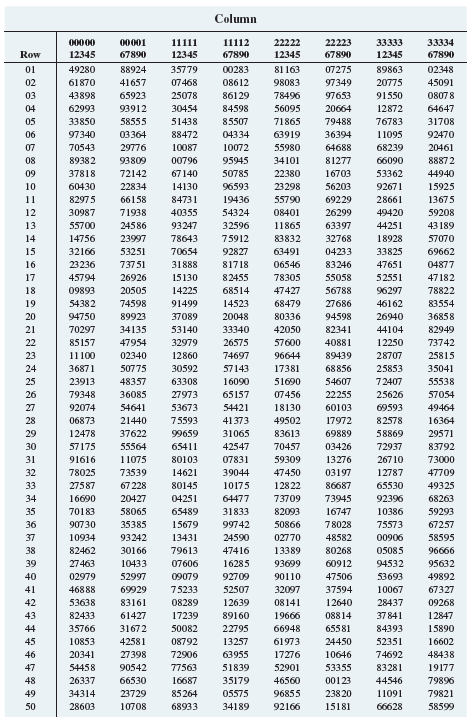
Use the table of random numbers (Table E.1) to simulate the selection of different-colored balls from an urn, as follows:a. Start in the row corresponding to the day of the month in which you were
For a period of four weeks, record your pulse rate (in beats per minute) just after you get out of bed in the morning and then again before you go to sleep at night. Construct X and R charts and
What should you do to improve a process when only common causes of variation are present?
What should you do to improve a process when special causes of variation are present?
Obtain a version of the red bead experiment for your class.a. Conduct the experiment in the same way as described in this section.b. Remove 400 red beads from the bead bowl before beginning the
The file HybridSales contains the number of domestic and imported hybrid vehicles sold in the United States from 1999 to 2016.Source: Data extracted from Oak Ridge National Laboratory, “Vehicle
The file Philly contains a sample of 25 neighborhoods in Philadelphia. Variables included are neighborhood population, median sales price of homes in the second quarter of 2017, mean number of days
The file EuroTourism2 contains a sample of 28 European countries. Variables included are the number of jobs generated in the travel and tourism industry in 2015, the spending on business travel
In recent years, the share of Greek yogurts in the U.S. yogurt market has grown from 1% to over 50%, greatly increasing the variety of Greek yogurts available for sale. The file Yogurt contains the
With an assist from Moneyball: The Art of Winning an Unfair Game, a book by Michael Lewis, published in 2003 (and later adapted for the movie Moneyball), the management of professional teams in
Develop a model to predict the asking price of houses in Silver Spring, Maryland, based on living space, lot size, whether the has a fireplace, the number of bedrooms, the number of bathrooms, age,
A specialist in baseball analytics seeks to study which baseball teams were most similar in a recent season. The specialist has collected data in Baseball related to ERA, saves, runs scored, hits
A market research study has been conducted by a travel website that specializes in restaurants with the business objective to determine which food cuisines are perceived to be similar and which are
A specialist in baseball analytics is interested in determining which variables are important in predicting a team’s wins in a given baseball season. He has collected data in Baseball that includes
Using to the data in Problem 17.27,a. Use half the data as the training sample and the other half of the data as the validation sample to develop a regression tree model to predict wine quality.
The production of wine is a multibillion-dollar worldwide industry. In an attempt to develop a model of wine quality as judged by wine experts, data were collected from red and white winevariants of
How does multiple correspondence analysis differ from multidimensional scaling?
What is the difference between supervised and unsupervised analytics methods?
Have you wondered how Internet connection speed varies around the globe? The file ConnectionSpeed contains the mean connection speed, the mean peak connection speed, the percent of the time the
The file MobileSpeed contains the overall download and upload speeds in mbps for nine carriers in the United States.Source: Data extracted from “Best Mobile Network 2016,” bit.ly/1KGPrMm,
The file Social Response contains the product category, sentiment rating, and customer type and frequency of posting (low, average, high) for 300 recently posted comments to a retailer’s community
The restaurant owner in Problem 2.91 continues to learn more about the weekend patterns of patron demand. For each patron, the owner has collected and stored in Patrons the gender, the entrée
Have you wondered how Internet connection speed varies around the globe? The file ConnectionSpeed contains the mean connection speed, the mean peak connection speed, the percent of the time the
The file MobileSpeed contains the overall download and upload speeds in mbps for nine carriers in the United States.Source: Data extracted from “Best Mobile Network 2016,” bit.ly/1KGPrMm,
In mining engineering, holes are often drilled through rock using drill bits. As a drill hole gets deeper, additional rods are added to the drill bit to enable additional drilling to take place. It
As a consultant to an investment company trading in various currencies, you have been assigned the task of studying long-term trends in the exchange rates of the Canadian dollar, the Japanese yen,
Teachers’ Retirement System of the City of New York offers several types of investments for its members. Among the choices are investments with fixed and variable rates of return. There are several
The data stored in McDonalds represent the gross revenues (in billions of current dollars) of McDonald’s Corporation from 1975 through 2016:a. Plot the data.b. Compute the linear trend forecasting
The U.S. Department of Labor gathers and publishes statistics concerning the labor market. The file Workforce contains data on the size of the U.S. civilian noninstitutional population of people 16
How does forecasting for monthly or quarterly data differ from forecasting for annual data?
What are the different approaches to choosing an appropriate forecasting model?
How does auto-regressive modeling differ from the other approaches to forecasting?
How does the least-squares linear trend forecasting model developed in this chapter differ from the least-squares linear regression model considered in Chapter 13?
Under what circumstances is the exponential trend model most appropriate?
The file Gold contains the price in London for an ounce of gold (in US$) at the end of each quarter from 2004 through 2016.Source: Data extracted from USAGold, “Daily Gold Price History,”
The file Silver-Q contains the price in London for an ounce of silver (in US$) at the end of each quarter from 2004 through 2016.Source: Data extracted from USAGold, “Daily Silver Price History,”
The file Freezer from January 2012 to December 2016 contains the number (in thousands) of freezer shipments in the United States from January 2012 to December 2016.Source: Data extracted from
Are gasoline prices higher during the height of the summer vacation season than at other times? The file GasPrices contains the mean monthly prices (in $/gallon) for unleaded gasoline in the United
The data in Toys R Us are quarterly revenues (in $millions) for Toys R Us from 1996-Q1 through 2017-Q1.Source: Data extracted from Standard & Poor’s Stock Reports, November 1995, November 1998,
Refer to the exponential model given in Problem 16.42.a. What is the fitted value of the series in the fourth quarter of 2017?b. What is the fitted value of the series in the first quarter of 2017?c.
In forecasting a quarterly time series over the five-year period from the first quarter of 2013 through the fourth quarter of 2017, the exponential trend forecasting equation is given bywhere quarter
In forecasting a monthly time series over a five-year period from January 2013 to December 2017, the exponential trend forecasting equation for January isTake the antilog of the appropriate
Using the yearly amount of solar power generated by utilities (in millions of kWh) in the United States from 2002 through 2016 data for Problem 16.16 on page 645 (stored in SolarPower),a. Fit a
Using the average baseball salary from 2000 through 2017 data for Problem 16.18 on page 645 (stored in BBSalaries),a. Fit a third-order autoregressive model to the average baseball salary and test
Using the data for Problem 16.17 on page 645 concerning the number of passenger cars produced in the United States from 1999 to 2016 (stored in CarProduction ),a. Fit a third-order autoregressive
Using the data for Problem 16.12 on page 645 concerning the bonuses paid to workers on Wall Street from 2000 to 2016 (stored in Bonuses),a. Fit a third-order autoregressive model to the bonuses paid
Using the data for Problem 16.15 on page 645 that represent the number of new, single-family houses sold in the U.S. from 1992 through 2016 (stored in HouseSales),a. Fit a third-order autoregressive
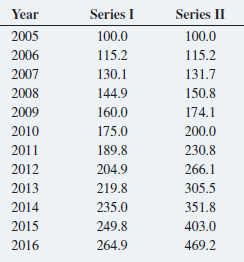
A time-series plot often helps you determine the appropriate model to use. For this problem, use each of the time series presented in the following table and stored in TSModel2:a. Plot the observed
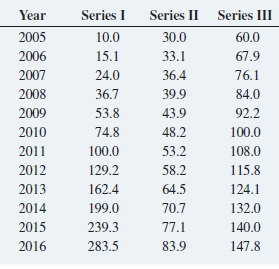
Although you should not expect a perfectly fitting model for any time-series data, you can consider the first differences, second differences, and percentage differences for a given series as guides
The data in CPI-U reflect the annual values of the consumer price index (CPI) in the United States over the 52-year period 1965 through 2016, using 1982 through 1986 as the base period. This index
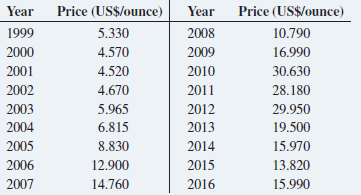
The file Silver contains the following prices in London for an ounce of silver (in US$) on the last day of the year from 1999 to 2016:a. Plot the data.b. Compute a linear trend forecasting equation
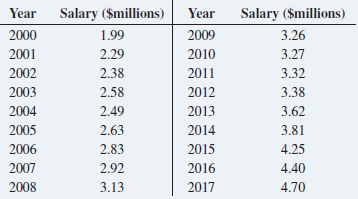
The average salary of Major League Baseball players on opening day from 2000 to 2017 is stored in BBSalaries and shown below.a. Plot the data.b. Compute a linear trend forecasting equation and plot
The file CarProduction contains the number of passenger cars produced in the U.S. (in thousands) from 1999 to 2016.Source: Data extracted from www.statista.com.a. Plot the data.b. Compute a linear
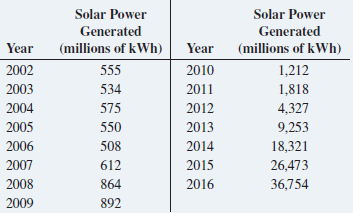
The data shown in the following table and stored in Solar Power represent the yearly amount of solar power generated by utilities (in millions of kWh) in the United States from 2002 through 2016:a.
The file HouseSales contains the number of new, single-family houses sold in the U.S. from 1992 through 2016.a. Plot the data.b. Compute a linear trend forecasting equation and plot the trend line.c.
The data in FedReceipt represent federal receipts from 1978 through 2016, in billions of current dollars, from individual and corporate income tax, social insurance, excise tax, estate and gift tax,
Gross domestic product (GDP) is a major indicator of a nation’s overall economic activity. It consists of personal consumptionexpenditures, gross domestic investment, net exports of goods and
There has been much publicity about bonuses paid to workers on Wall Street. Just how large are these bonuses? The file Bonuses contains the bonuses paid (in $000) from 2000 to 2016.Source: Data
The linear trend forecasting equation for an annual time series containing 42 values (from 1976 to 2017) on net sales (in $billions) isa. Interpret the Y intercept, b0.b. Interpret the slope, b1.c.
The linear trend forecasting equation for an annual time series containing 22 values (from 1996 to 2017) on total revenues (in $millions) isa. Interpret the Y intercept, b0.b. Interpret the slope,
The file IPOs contains the number of initial public offerings (IPOs) issued from 2001 through 2016.Source: Data extracted from K.W. Hanley, “The Economics of Primary Markets,” available at
The data (stored in CoffeeExports ) represent the coffee exports (in thousands of 60 kg bags) by Costa Rica from 2004 to 2016:a. Plot the data.b. Fit a three-year moving average to the data and plot
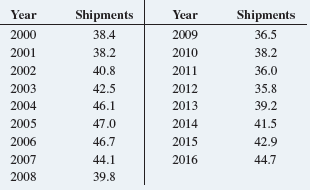
The following data, stored in CoreAppliances provide the total number of shipments of core major household appliances in the U.S. from 2000 to 2016 (in millions).a. Plot the time series.b. Fit a
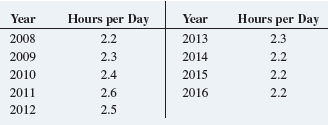
The data below (stored in DesktopLaptop) represent the hours per day spent by American desktop/ laptop users from 2008 to 2016.a. Plot the time series.b. Fit a three-year moving average to the data
You are using exponential smoothing on an annual time series concerning total revenues (in $millions). You decide to use a smoothing coefficient of W = 0.20, and the exponentially smoothed value for
If you are using exponential smoothing for forecasting an annual time series of revenues, what is your forecast for next year if the smoothed value for this year is $32.4 million?
A sample of 61 houses recently listed for sale in Silver Spring, Maryland, was selected with the objective of developing a model to predict the taxes (in $) based on the asking price of houses (in
A baseball analytics specialist wants to determine which variables are important in predicting a team’s wins in a given season. He has collected data related to wins, earned run average (ERA), and
In Problems 15.32–15.36 you developed multiple regression models to predict the fair market value of houses in Glen Cove, Roslyn, and Freeport. Now write a report based on the models you developed.
The file Cities contains a sample of 25 cities in the United States. Variables included are city average annual salary ($), unemployment rate (%), median home value ($thousands), number of violent
A specialist in baseball analytics has expanded his analysis, presented in Problem 14.77 on page 580, of which variables are important in predicting a team’s wins in a given baseball season. He has
Showing 1 - 100
of 479
1
2
3
4
5