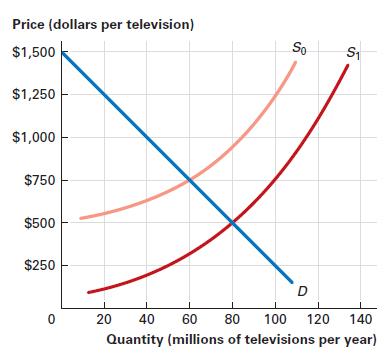
5.5 The figure shows the market for televisions. The initial supply curve is S0. After a change...
Question:
5.5 The figure shows the market for televisions. The initial supply curve is S0. After a change occurs, the supply curve becomes S1.

a. Before the change occurs, what were the initial equilibrium price and quantity? After the change occurs, what are the new equilibrium price and quantity?
b. Give an example of a change that could lead to the shift illustrated in the figure.
c. Based on your answer to part
b, if you are an executive at a firm like LG Corporation, a Korean manufacturer of televisions, what managerial decisions will you make?
Fantastic news! We've Found the answer you've been seeking!
Step by Step Answer:
Related Book For 

Question Posted:


