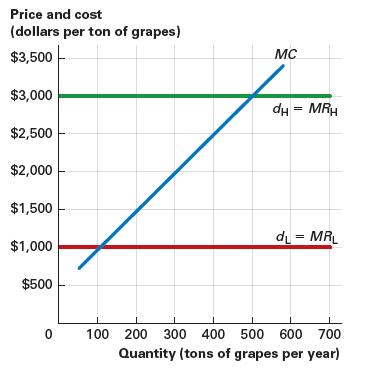
The figure shows the two potential demand curves and the marginal cost curve for the production of
Question:
The figure shows the two potential demand curves and the marginal cost curve for the production of grapes by your vineyard.
a. If the probability of demand being high, dH, is 75 percent and the probability of demand being low, dL, is 25 percent, what quantity of grapes maximizes your expected profit?
b. Suppose that the probability of high demand changes to 25 percent, so the probability of low demand is 75 percent. Now what quantity of grapes maximizes your expected profit?
c. How does a change in the expected marginal revenue affect the quantity produced?

Fantastic news! We've Found the answer you've been seeking!
Step by Step Answer:
Related Book For 

Question Posted:


