Q2. Gold Trackers monitors the price of precious metals and has daily data on prices and sales of gold for the past several years.

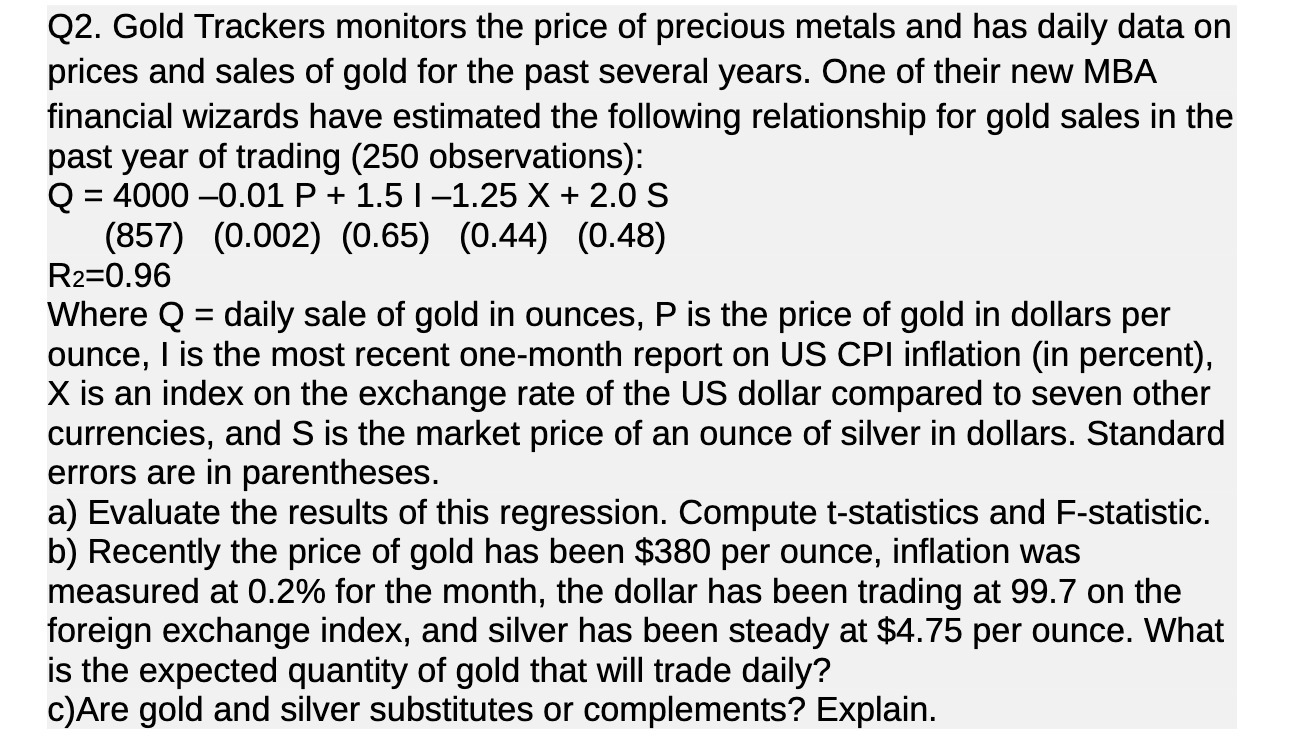
Q2. Gold Trackers monitors the price of precious metals and has daily data on prices and sales of gold for the past several years. One of their new MBA financial wizards have estimated the following relationship for gold sales in the past year of trading (250 observations): Q = 4000 -0.01 P + 1.5 | 1.25 X + 2.0 S (857) (0.002) (0.65) (0.44) (0.48) R2=0.96 Where Q = daily sale of gold in ounces, P is the price of gold in dollars per ounce, I is the most recent one-month report on US CPI inflation (in percent), X is an index on the exchange rate of the US dollar compared to seven other currencies, and S is the market price of an ounce of silver in dollars. Standard errors are in parentheses. a) Evaluate the results of this regression. Compute t-statistics and F-statistic. b) Recently the price of gold has been $380 per ounce, inflation was measured at 0.2% for the month, the dollar has been trading at 99.7 on the foreign exchange index, and silver has been steady at $4.75 per ounce. What is the expected quantity of gold that will trade daily? c)Are gold and silver substitutes or complements? Explain.
Step by Step Solution
There are 3 Steps involved in it
Step: 1
To solve the problem heres how we approach each part a Evaluate the results of this regression Compute tstatistics and Fstatistic tstatistics To compu...
See step-by-step solutions with expert insights and AI powered tools for academic success
Step: 2

Step: 3

Ace Your Homework with AI
Get the answers you need in no time with our AI-driven, step-by-step assistance
Get Started


