

3.2 Province by Province A group of items are categorized according to a certain attribute-X, Y, Z-and
Question:
3.2 Province by Province A group of items are categorized according to a certain attribute-X, Y, Z-and according to the province in which they are produced:
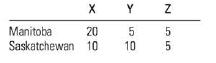
a. Create a comparative (side-by-side) bar chart to compare the numbers of items of each type made in Manitoba and Saskatchewan.
b. Create a stacked bar chart to compare the numbers of items of each type made in the two provinces.
c. Which of the two types of presentation in parts a and b is more easily understood? Explain.
d. What other graphical methods could you use to describe the data?
Fantastic news! We've Found the answer you've been seeking!
Step by Step Answer:

Answered By
OTIENO OBADO
I have a vast experience in teaching, mentoring and tutoring. I handle student concerns diligently and my academic background is undeniably aesthetic
3+ Reviews
10+ Question Solved
Related Book For 
Introduction To Probability And Statistics
ISBN: 9780176509804
3rd Edition
Authors: William Mendenhall
Question Posted:
