

Canada has a Road Safety Vision of having the safest roads in the world. Yet, the lead-
Question:
Canada has a Road Safety Vision of having the safest roads in the world. Yet, the lead- ing cause of death of Canadian children remains vehicle crashes. In 2006, a national child safety seat survey was conducted by an AUTO21 research team in collaboration with Transport Canada to empirically measure Canada's progress toward achieving Road Safety Vision 2010. Child seat use was observed in parking lots and nearby in- tersections in 200 randomly selected sites across Canada. The following table provides a classification of a subset of children in the survey by age group and type of restraint device they were using at the time of the survey. This research was supported in part by the AUTO21 Network of Centres of Excellence. Reference: T. Yiwen, A. Snowdon, S.E. Ahmed, and A.A. Hussein (2009). Accommo- dating Nonrespondents in the Canadian National Child Safety Seat Survey. Submitted to Injury Prevention.
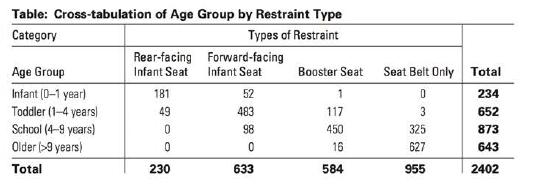
a. What are some of the variables measured in this survey? Are they qualitative or quantitative?
b. Construct a side-by-side bar chart to describe the data in the table. Create a stacked bar chart to describe these data.
c. Construct a pie chart for each of the age groups. Which of the charts created above best depicts the difference or similarity of use of toddler restraint types?
d. Write a short paragraph summarizing the information that can be gained by looking at these graphs. Which of the three types of comparative graphs is more effective?
e. Perhaps you can suggest another graphical technique to display this data that will be the most effective one.
Step by Step Answer:


Introduction To Probability And Statistics
ISBN: 9780176509804
3rd Edition
Authors: William Mendenhall
