

Scatterplots, Correlation, and the Regression Line The data from Example 2.16 give the front and rear leg
Question:
Scatterplots, Correlation, and the Regression Line The data from Example 2.16 give the front and rear leg rooms (in centimetres) for nine different sport-utility ve- hicles, as shown in Table 3.9:
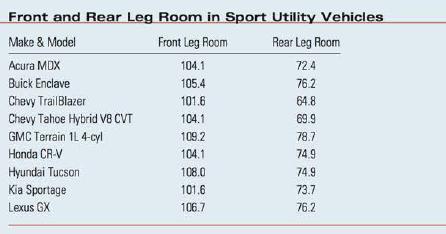 1. If you did not save the MINITAB worksheet from Chapter 2, enter the data into the first three columns of another MINITAB worksheet, using the labels in the table. To examine the relationship between the front and rear leg rooms, you can plot the data and numerically describe the relationship with the correlation coefficient and the best-fitting line. 2. Select Stat Regression Fitted Line Plot, and select "Front Leg Room" and "Rear Leg Room" for Y and X, respectively (see Figure 3.17(a)). Make sure that the radio button next to Linear is selected, and click OK. The plot of the nine data points and the best-fitting line will be generated as in Figure 3.17(b).
Step by Step Answer:

This question has not been answered yet.
You can Ask your question!

Introduction To Probability And Statistics
ISBN: 9780176509804
3rd Edition
Authors: William Mendenhall
