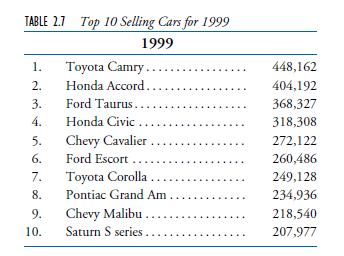
Table 2.7 lists the 10 top-selling passenger cars in the United States in 1999. A simple calculation
Question:
Table 2.7 lists the 10 top-selling passenger cars in the United States in 1999. A simple calculation gives that the sample mean and sample standard deviation of

these data are
![]()
Thus Chebyshev’s inequality yields that at least 100(5/9)= 55.55 percent of the data lies in the interval

Fantastic news! We've Found the answer you've been seeking!
Step by Step Answer:
Related Book For 

Introduction To Probability And Statistics For Engineers And Scientists
ISBN: 9780125980579
3rd Edition
Authors: Sheldon M. Ross
Question Posted:


