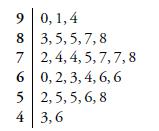
The following stem and leaf plot gives the scores on a statistics exam taken by industrial engineering
Question:
The following stem and leaf plot gives the scores on a statistics exam taken by industrial engineering students.

By standing the stem and leaf plot on its side we can see that the corresponding histogram is approximately normal. Use it to assess the empirical rule.
Step by Step Answer:
Related Book For 

Introduction To Probability And Statistics For Engineers And Scientists
ISBN: 9780125980579
3rd Edition
Authors: Sheldon M. Ross
Question Posted:


