The macroeconomic effects of the indexation of wages Suppose that the Phillips curve is given by: [
Question:
The macroeconomic effects of the indexation of wages Suppose that the Phillips curve is given by:
\[
\pi_{t}-\pi_{t}^{e}=0.1-2 u_{t}
\]
where
\[
\pi_{t}^{e}=\pi_{t-1}
\]
Suppose that inflation in year \(t-1\) is zero. In year \(t\), the central bank decides to keep the unemployment rate at \(4 \%\) forever.
a. Compute the rate of inflation for years \(t, t+1, t+2\), and \(t+3\).
Now suppose that half the workers have indexed labor contracts.
b. What is the new equation for the Phillips curve?
c. Based on your answer to part (b), recompute your answer to part (a).
d. What is the effect of wage indexation on the relation between \(\pi\) and \(u\) ?
7. Estimating the natural rate of unemployment To answer this question, you will need data on the annual U.S. unemployment and inflation rates since 1970, which can be obtained very easily from the Economic Report of the President https://www.whitehouse.gov/sites/default/files/ docs/2015_erp_appendix_b.pdf Excel tables of the values can be downloaded.
Retrieve the annual data for the civilian unemployment rate. In the 2015 ERP, this is Table B-12. In addition, retrieve the annual percentage increase for the consumer price index (CPI), all urban consumers. In the 2015 ERP, this is Table B-10. You can access the same data at the Federal Reserve Bank of St. Louis FRED Web site.
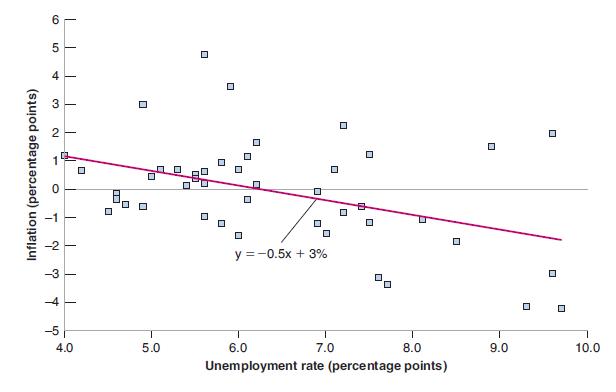
a. Plot the data for all the years since 1970 on a diagram, with the change in inflation on the vertical axis and the rate of unemployment on the horizontal axis. Is your graph similar to Figure 8-4 ?
Figure 8-4

b. Using a ruler, draw the line that appears to fit best the points in the figure. Approximately what is the slope of the line? What is the intercept? Write down your equation.
c. According to your analysis in (b), what has been the natural rate of unemployment since 1970 ?
Step by Step Answer:


