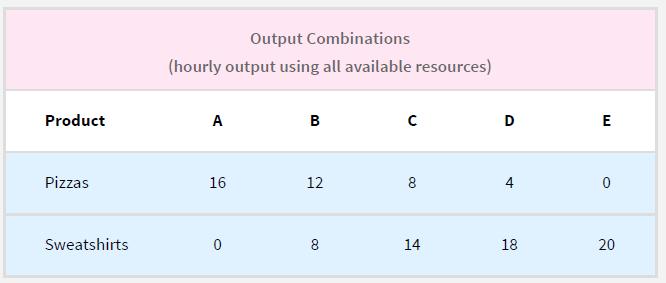
Suppose an economy in a cold climate makes sweatshirts and pizzas. The accompanying table shows several of
Question:
Suppose an economy in a cold climate makes sweatshirts and pizzas. The accompanying table shows several of the economy’s efficient output combinations. Draw the production possibilities frontier for this economy on a graph with the quantity of pizzas on the horizontal axis and the quantity of sweatshirts on the vertical axis. Label this curve PPF1.
Now suppose new oven technology increases pizza production by 50%. In other words, for each quantity of sweatshirts that can be made, the quantity of pizzas that can also be made is 1.5 times higher than before. Draw the new PPF and label the new points F, G, H, I, and J, from right to left. Label this curve PPF2. Explain why one point on PPF1 is also on PPF2.
Fantastic news! We've Found the answer you've been seeking!
Step by Step Answer:
Related Book For 

Question Posted:


