

3. The following table contains data on the relationship between saving and income. Rearrange these data into
Question:
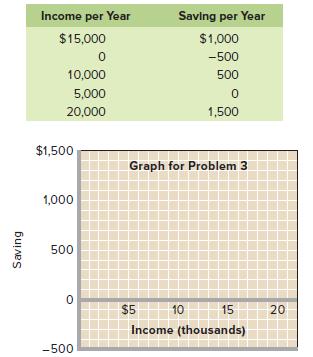
3. The following table contains data on the relationship between saving and income. Rearrange these data into a meaningful order and graph them on the accompanying grid. What is the slope of the line? The vertical intercept? Write the equation that represents this line. What would you predict saving to be at the $12,500 level of income? LO1.8
Step by Step Answer:

This question has not been answered yet.
You can Ask your question!
Related Book For 

Macroeconomics
ISBN: 9781259915673
21st Edition
Authors: Campbell McConnell, Stanley Brue , Sean Flynn
Question Posted:
