

Petro-Flo Corporation designs and manufactures fluid transfer components found in engine and transmission systems of expensive, heavy
Question:
Petro-Flo Corporation designs and manufactures fluid transfer components found in engine and transmission systems of expensive, heavy equipment. These systems often are contained in earth-moving equipment used under harsh conditions ranging from Middle Eastern oil fields to Canadian real estate development projects. Because of protection granted by patented designs and the company's uncompromising dedication to service, Petro-Flo has enjoyed a dominant position within the industry. If a Petro-Flo fuel system malfunctions, regardless of where the equipment is in use, an engineer will be assigned to assist the customer. Sometimes the engineer can ship a replacement part by express air. However, occasionally he or she must travel to the job site to personally assess the cause of the problem and to make recommendations for repairing the system.
The business environment is changing as a result of innovations introduced by PetroFlo's competitors. Therefore, cost management and quality control have received greater attention in recent years. In 2005, top management believed some managers had grown complacent as a result of previous successes in a very different business climate. As within many companies, the production, marketing, and service departments traditionally had functioned independently. In order to call attention to quality costs, management established a program to identify and manage quality expenditures as well as to serve as a basis for performance evaluation. Excerpts from the company's general ledger appear in Exhibit A.
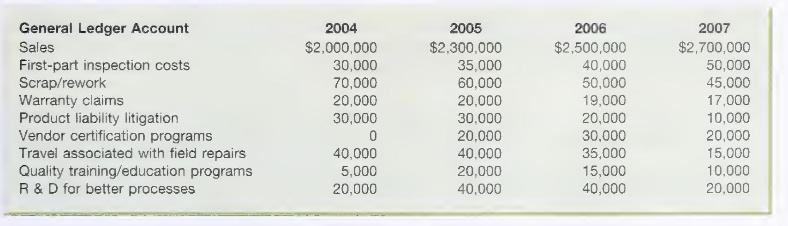
After three years of using quality cost as a performance measurement criterion, some managers disagreed with the emphasis placed on identifying quality spending. These managers argued their main focus should be on nonfinancial variables such as scrap rates, machine downtime, on-time delivery, and the number of field breakdowns. They believed statistical process control charts provided immediately useful detailed process information for making quality improvements. These managers argued that after four years of tracking quality costs, total quality spending is not significantly lower than in 2004, one year prior to the introduction of the quality program.
Consider the following guidelines when preparing your analysis of the case.
\section*{Required}
A. Discuss the purposes of a quality cost system as envisioned by management (such as cultural change and attention-getting).
B. Classify the costs in Exhibit A according to the following categories: internal failure, external failure, prevention, and appraisal.
C. Analyze the trends in quality spending. Prepare a stacked bar graph to analyze total quality costs. Prepare another graph to identify trends in spending by each type of cost category. (Hint: You may wish to prepare graphs in absolute dollars and percentage of sales.)
D. Consider the appropriate use of quality measures such as SPC charts and other nonfinancial measures of performance. Do these measures complement financial measures of quality?
E. How frequently should a company capture financial and nonfinancial measures?
Step by Step Answer:

This question has not been answered yet.
You can Ask your question!


Managerial Accounting Information For Decisions
ISBN: 9780324222432
4th Edition
Authors: Thomas L. Albright , Robert W. Ingram, John S. Hill
