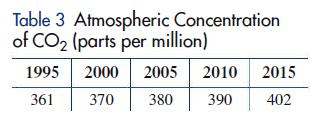
Table 3 contains information about the concentration of carbon dioxide (CO 2 ) in the atmosphere. The
Question:
Table 3 contains information about the concentration of carbon dioxide (CO2) in the atmosphere. The linear regression model for the data is C = 360 + 2.04t where C is the concentration (in parts per million) of carbon dioxide and t is the time in years with t = 0 corresponding to the year 1995.
(A) Interpret the slope of the regression line as a rate of change.
(B) Use the regression model to predict the concentration of CO2 in the atmosphere in 2025.

Fantastic news! We've Found the answer you've been seeking!
Step by Step Answer:
Related Book For 

Finite Mathematics For Business Economics Life Sciences And Social Sciences
ISBN: 9780134862620
14th Edition
Authors: Raymond Barnett, Michael Ziegler, Karl Byleen, Christopher Stocker
Question Posted:


