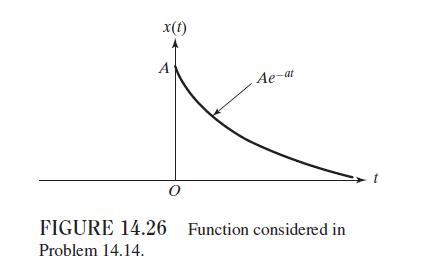
Find the Fourier transform of the functions shown in Figs. 14.26 and plot the corresponding spectrum. Figure
Question:
Find the Fourier transform of the functions shown in Figs. 14.26 and plot the corresponding spectrum.
Figure 14.26:-

Fantastic news! We've Found the answer you've been seeking!
Step by Step Answer:
Related Book For 

Question Posted:


