1.The following graph represents the market for wheat. The equilibrium price is $20 per bushel and the...
Question:
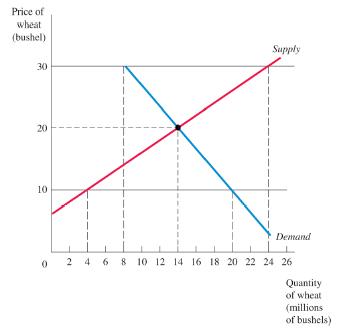
1.The following graph represents the market for wheat. The equilibrium price is $20 per bushel and the equilibrium quantity is 14 million bushels.

a. Explain what will happen if the government establishes a price ceiling of $10 per bushel of wheat in this market? What if the price ceiling was set at $30?
b. Explain what will happen if the government establishes a price floor of $30 per bushel of wheat in this market.
What if the price floor was set at $10?
Fantastic news! We've Found the answer you've been seeking!
Step by Step Answer:
Related Book For 

Principles Of Economics
ISBN: 9780135161104
13th Edition
Authors: Karl E. Case, Ray C. Fair, Sharon E. Oster
Question Posted:


