=+11.8. For the time series data in Example 4.1 of Chapter 3, use the Mann test based
Question:
=+11.8. For the time series data in Example 4.1 of Chapter 3, use the Mann test based on Spearman’s rank correlation coefficient to see if the data show a positive trend.
Industry Japan United States Food 0.8 0.4 Textiles 1.2 0.5 Paper 0.7 1.3 Chemicals 3.8 4.7 Petroleum 0.4 0.7 Rubber 2.9 2.2 Ferrous metals 1.9 0.5 Nonferrous metals 1.9 1.4 Metal products 1.6 1.3 Machinery 2.7 5.8 Electrical equipment 5.1 4.8 Motor vehicles 3.0 3.2 Other transport equipment 2.6 1.2 Instruments 4.5 9.0 Year Divorce rate 1945 3.5 1950 2.6 1955 2.3 1960 2.2 1965 2.5 1970 3.5 1975 4.8 1980 5.2 1985 5.0 446 CHAPTER 11
Fantastic news! We've Found the answer you've been seeking!
Step by Step Answer:
Related Book For 

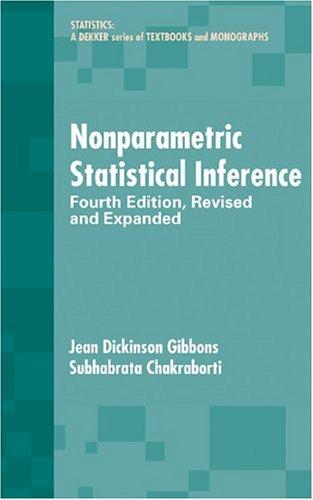
Nonparametric Statistical Inference
ISBN: 9780824740528
4th Edition
Authors: Gibbons, Jean Dickinson, Chakraborti, Subhabrata
Question Posted:


