The scatterplots shown below each have a superimposed regression line. If we were to construct a residual
Question:
The scatterplots shown below each have a superimposed regression line. If we were to construct a residual plot (residuals versus x) for each, describe what those plots would look like.
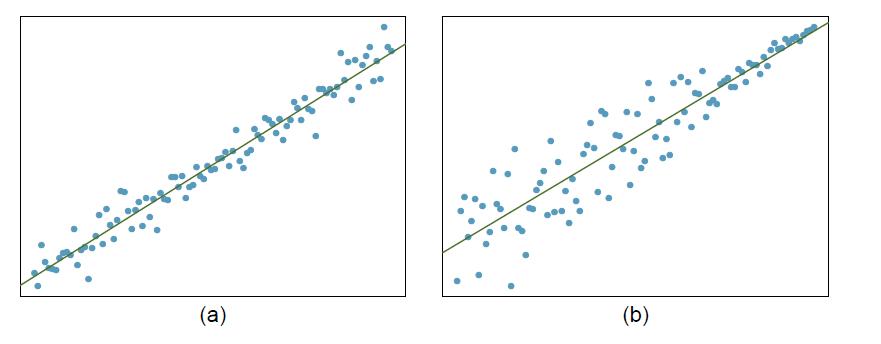
Transcribed Image Text:
(a) (b)
Fantastic news! We've Found the answer you've been seeking!
Step by Step Answer:
Answer rating: 80% (5 reviews)
Residual plots are a graphical representation that show the residuals on the vertical axis and the i...View the full answer
Answered By
Carly Cimino
As a tutor, my focus is to help communicate and break down difficult concepts in a way that allows students greater accessibility and comprehension to their course material. I love helping others develop a sense of personal confidence and curiosity, and I'm looking forward to the chance to interact and work with you professionally and better your academic grades.
4.30+
12+ Reviews
21+ Question Solved
Related Book For
OpenIntro Statistics
ISBN: 9781943450077
4th Edition
Authors: David Diez, Mine Çetinkaya-Rundel, Christopher Barr
Question Posted:
Students also viewed these Statistics questions
-
This activity presumes that you have already worked through Activity 9.1. In Section 9.2, it was suggested that a confidence interval of the form where is an alternative to the usual large-sample z...
-
The College Athletes data set on the text CD comes from a study of University of Georgia female athletes. The response variable BP = maximum bench press (1RM in data set) has explanatory variables...
-
Open the applet (available in Thomson NOW at www.thomsonedu.com/login) called Confidence Intervals. You should see a screen like the one shown. Getting Started: If the Method box does not say Means,...
-
Blue Spruce Corporation, a public company, is a large silver producer. Selected condensed information (in millions) for Blue Spruce Corporation follows for the year ended September 30, 2021: Cost of...
-
Washer Company has a reporting unit resulting from an earlier business combination. The reporting units current assets and liabilities are Required Determine the amount of goodwill to be reported and...
-
Assume that both you and Art, your partner in a picture-framing business, want to increase your firms total revenue. You argue that in order to achieve this goal, you should lower your prices; Art,...
-
3. Why could growth through a series of bolt-on acquisitions createmore value than growth through a single large acquisition? (Consider premium paid and synergies created for each individual...
-
Study the following Minitab output from a regression analysis to predict y from x. a. What is the equation of the regression model? b. What is the meaning of the coefficient of x? c. What is the...
-
Postmates, a meal delivery service, which has recently partnered with Uber is experiencing rapid growth. Postmates dividends are expected to grow at 35% per year during the next four years, 18% over...
-
The Great Britain Office of Population Census and Surveys once collected data on a random sample of 170 married couples in Britain, recording the age (in years) and heights (converted here to inches)...
-
The two scatterplots below show the relationship between final and mid-semester exam grades recorded during several years for a Statistics course at a university. (a) Based on these graphs, which of...
-
Read The Margins of Accounting by Peter Miller in The European Accounting Review (Volume 7, Number 4, 1998). What is Millers main point? Discuss the examples he uses to illustrate his main point...
-
Using the figure below, draw the FBD , ?Shear Force and Bending Moment diagrams and find the maximum internal moment for the beam shown. 10 kNm 10 kN 3 m
-
Suppose the goods market is: Y = 1800 - 100i and the LM curve Y = 500 +591, where x is the last digit of your ID number. Determine the equilibrium income (Y), interest rate (i). Explain the role of...
-
Complete the chart: [1] Length, L (m) Period, T (s) LogL LogT 0.10 0.63 0.20 0.90 0.30 1.00 0.40 1.27 0.50 1.42 0.60 1.55 0.70 1.68 0.80 1.80 0.90 1.90 1.00 2.02 Plot the data T vs L. [4 (title, axes...
-
A solid metal sphere with a diameter of 2 cm and a mass of 8 g is used for the following heat transfer experiments. You can assume the temperature throughout the inside of the metal sphere is...
-
2) A car 1200 kg is in a skid Force of friction 3200N and force of air resistance 1600N. Find the following i) The net force and acceleration of the car ii) The time required to stop from 95 km/hr...
-
Selected data from the O'Neal Company are presented below: Total assets.......................................................$1,500,000 Average...
-
What are the three kinds of research types? Explain each type.
-
Refer to the Baseball 2019 data, which report information on the 30 Major League Baseball teams for the 2019 season. Assume the 2019 data represent a sample. a. Develop a 95% confidence interval for...
-
Refer to the Baseball 2019 data. Compute the mean number of home runs per game. To do this, first find the mean number of home runs per team for 2019. Next, divide this value by 162 (a season...
-
Listed below are the 30 companies that make up the Dow Jones Industrial Average (DJIA) and the percent return in their stock price between January 1, 2019, and December 27, 2019. Make a boxplot for...
-
Imagine you are an Investor in the Stock Market. Identify three companies in the Korean Stock Market (KOSPI) where you would like to invest. Explain your answer
-
Domino is 4 0 years old and is married out of community of property with the exclusion of the accrual system to Dolly ( 3 5 ) . They have one child, Domonique, who is 1 1 years old. Domino resigned...
-
YOU ARE CREATING AN INVESTMENT POLICY STATEMENT FOR JANE DOE General: 60 years old, 3 grown children that are living on their own and supporting themselves. She is in a very low tax rate so we don't...
Study smarter with the SolutionInn App