

Question: The following table shows the data collected about a project. For the above project: (a) Draw an activity-on-arrow diagram showing the duration of each activity,
The following table shows the data collected about a project.
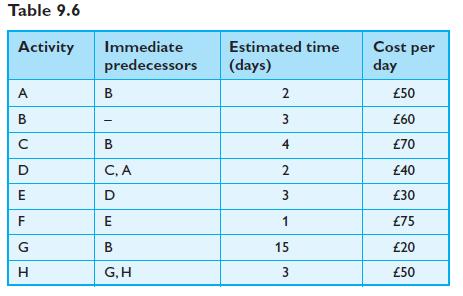
For the above project:
(a) Draw an activity-on-arrow diagram showing the duration of each activity, the earliest start and latest finish times
(b) Draw an activity-on-node diagram
(c) Determine the completion time and the project cost
(d) Identify the critical activities
(e) Calculate the total and free floats.
Table 9.6 Activity Immediate Estimated time predecessors (days) Cost per day A B 2 50 B 3 60 CDE B 4 70 C, A 2 40 D 3 30 F HGT E 1 75 B 15 20 G, H 3 50
Step by Step Solution
There are 3 Steps involved in it
1 Expert Approved Answer
Step: 1 Unlock

Question Has Been Solved by an Expert!
Get step-by-step solutions from verified subject matter experts
Step: 2 Unlock
Step: 3 Unlock