5. Consider the results of the repeated measurements experiment from Us- age note: Stat-40 (1997) from the
Question:
5. Consider the results of the repeated measurements experiment from Us-
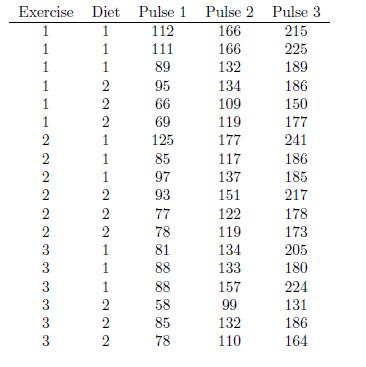
age note: Stat-40 (1997) from the University of Texas at Austin. In this experiment the purpose was to determine how diet and exercise aect the pulse of subjects. Eighteen subjects were randomly assigned to one of three exercises (1=aerobic stair climbing, 2=racquetball, 3=weight training) and one of two diets (1=include meat, 2=vegetarian). After a training period where all subjects followed their assigned exercise and diet routine, their pulse was measured three successive times (once after a warm-up, again after jogging and nally after running). The results are shown in the table on the next page.
(a) Make a plot of the average trend in pulse over the three repeat measures for each of the six combinations of diet and exercise.
(b) Do a normal split-plot analysis of the data treating diet and exercise as whole-plot factors and the repeated measurements as a subplot factor.
(c) Use the sphericity test to determine if the normal analysis is justied.
(d) Make the Huynh-Feldt and Greenhouse-Geisser adjusted F-tests for the subplot eects. Are the results dierent than the unadjusted tests?
(e) Do a conservative growth-curve analysis of the linear contrast in pulse measurements over time. Do the results of this analysis conrm what you found in
(b) and (d)? If not, why?
Step by Step Answer:

This question has not been answered yet.
You can Ask your question!