6. Czitrom and Spagon (1997) describe a split-plot experiment conducted in a semiconductor manufacturing facility. Oxidation of
Question:
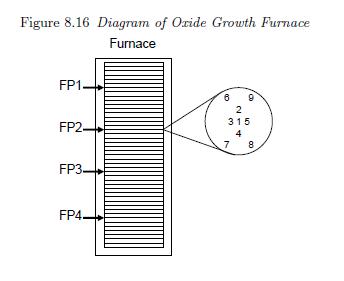
6. Czitrom and Spagon (1997) describe a split-plot experiment conducted in a semiconductor manufacturing facility. Oxidation of silicon in a well-
controlled environment is a critical step in fabrication of modern integrated circuits. A nine-nanometer thick oxide layer is grown on 200-mm silicon wafers in a vertical furnace. A quartz boat that rests on the oor of the furnace has room for 160 silicon wafers facing up. When furnace is sealed the temperature is slowly ramped up to 900, then oxygen gas is introduced which oxidizes the silicon on the surface of the wafer. When the thickness of the oxide reaches nine nanometers, the furnace run ends. The purpose of the experiments was to determine if the oxide thickness was aected by the position in the furnace or the site on the wafer. Oxide thickness was measured at four positions chosen in the furnace and nine specic sites or locations on each wafer in each of the four furnace positions. These were the two factors considered in the experiments. A schematic of the furnace is shown in Figure 8.16. The experimental unit for the furnace position eect was a wafer, while the experimental units for the site on a wafer were individual sites within a wafer. After one furnace run, the eect of furnace location was completely confounded with dierences in wafers. Therefore, eight replicate furnace runs or blocks were made randomizing the wafers placed in each of the four positions measured on each run. The data re-
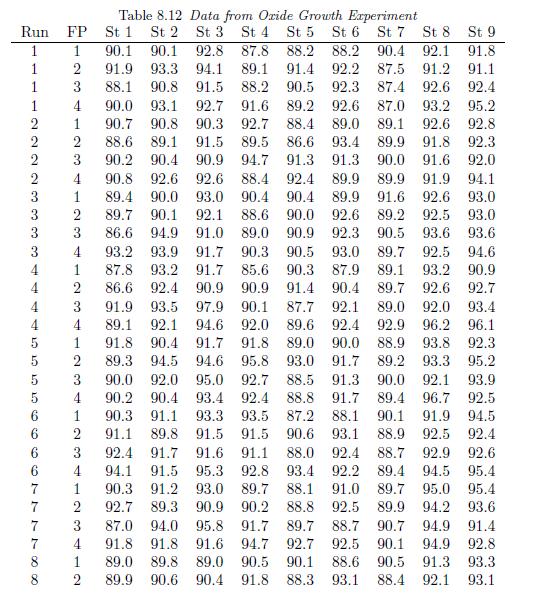
sulting the eight separate furnace runs is shown in Table 8.12 in a format similar to Tables 8.4 and 8.5
(a) What is the model for the data?
(b) Analyze the data using proc glm or proc mixed.
(c) Describe any signicant dierences you nd and interpret what these dierences mean by referring to tables or graphs of means or multiple comparison tests.
(d) Check the assumptions of equal variance and normality of the whole-plot and split-plot error terms as described in Section 5.9.
Step by Step Answer:

This question has not been answered yet.
You can Ask your question!