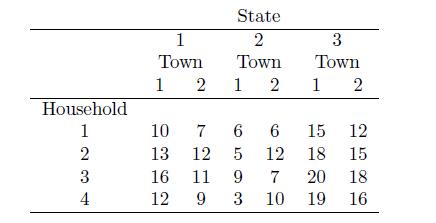
Consider the data (Anderson and McLean, 1974) in the following table to come from a sampling study
Question:
Consider the data (Anderson and McLean, 1974) in the following table to come from a sampling study to determine the source of variability in the average amount spent on health care per year in thousands of dollars.
Towns are nested within state and households are nested within town.
(a) Use the method of moments and REML methods to determine the vari-
ance components for state, town, and household.
(b) What percent of the total variance is due to households? Towns and households?
(c) Using formula (5.11) obtain a 90% condence interval on the variance component due to towns.
Fantastic news! We've Found the answer you've been seeking!
Step by Step Answer:
Related Book For 

Design And Analysis Of Experiments
ISBN: 9780471661597
6th International Edition
Authors: Douglas C. Montgomery
Question Posted:


