

Question: FIGURE P39.32 shows |(x)| 2 for the electrons in an experiment. a. Is the electron wave function normalized? Explain.b. Draw a graph of (x) over
FIGURE P39.32 shows |ψ(x)|2for the electrons in an experiment.
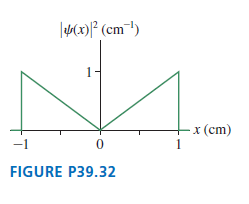
a. Is the electron wave function normalized? Explain.b. Draw a graph of ψ(x) over this same interval. Provide a numerical scale on both axes. (There may be more than one acceptable answer.)c. What is the probability that an electron will be detected in a 0.0010-cm-wide region at x = 0.00 cm? At x = 0.50 cm? At x = 0.999 cm?d. If 104 electrons are detected, how many are expected to land in the interval -0.30 cm ?? x ?? 0.30 cm?
lKx) (cm) 1 x (cm) FIGURE P39.32
Step by Step Solution
3.49 Rating (166 Votes )
There are 3 Steps involved in it
Model The probability of finding a particle at position x is determined by Px x 2 Visualize So... View full answer

Get step-by-step solutions from verified subject matter experts
Document Format (2 attachments)
1442_6054778c010b2_701115.pdf
180 KBs PDF File
1442_6054778c010b2_701115.docx
120 KBs Word File