

Question: The gasoline engine in your car can be modeled as the Otto cycle shown in FIGURE CP21.73. A fuel-air mixture is sprayed into the cylinder
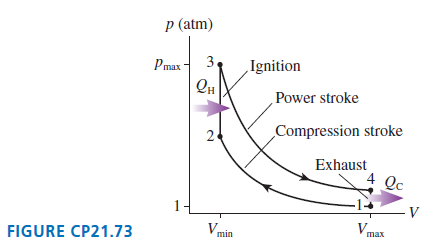
The gasoline engine in your car can be modeled as the Otto cycle shown in FIGURE CP21.73. A fuel-air mixture is sprayed into the cylinder at point 1, where the piston is at its farthest distance from the spark plug. This mixture is compressed as the piston moves toward the spark plug during the adiabatic compression stroke. The spark plug fires at point 2, releasing heat energy that had been stored in the gasoline. The fuel burns so quickly that the piston doesn€™t have time to move, so the heating is an isochoric process. The hot, high-pressure gas then pushes the piston outward during the power stroke. Finally, an exhaust value opens to allow the gas temperature and pressure to drop back to their initial values before starting the cycle over again.
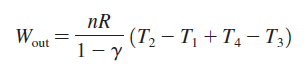
a. Analyze the Otto cycle and show that the work done per cycle is
b. Use the adiabatic connection between T1 and T2 and also between T3 and T4 to show that the thermal efficiency of the Otto cycle is
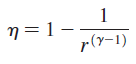
where r = Vmax /Vmin is the engine€™s compression ratio. c. Graph h versus r out to r = 30 for a diatomic gas.
p (atm) 3 Pmax - Ignition Power stroke Compression stroke 24 Exhaust 4 Qc Vmin FIGURE CP21.73 max nR Wo (T, T, + T4 T3) out 1- y
Step by Step Solution
3.34 Rating (160 Votes )
There are 3 Steps involved in it
Model Process 1 2 and process 3 4 are adiabatic and process ... View full answer

Get step-by-step solutions from verified subject matter experts
Document Format (2 attachments)
1442_6054778ba0032_693693.pdf
180 KBs PDF File
1442_6054778ba0032_693693.docx
120 KBs Word File