

Question: What problems, if any, are visible in the control charts in Fig. 18.5.3? What action (if any) would you suggest? Fig 18.5.3 10 10 -
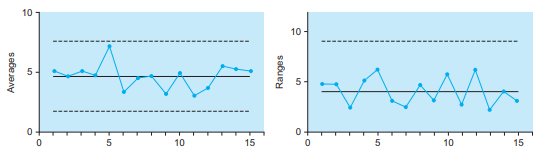
What problems, if any, are visible in the control charts in Fig. 18.5.3? What action (if any) would you suggest?
Fig 18.5.3
10 10 - 5 15 10 15 10 Averages
Step by Step Solution
★★★★★
3.40 Rating (162 Votes )
There are 3 Steps involved in it
1 Expert Approved Answer
Step: 1 Unlock

This process is ... View full answer
Question Has Been Solved by an Expert!
Get step-by-step solutions from verified subject matter experts
Step: 2 Unlock
Step: 3 Unlock