

Question: Refer to Exercise 91. Here are a boxplot and some numerical summaries of the electoral vote data: a. Explain why the median and IQR would
Refer to Exercise 91. Here are a boxplot and some numerical summaries of the electoral vote data:
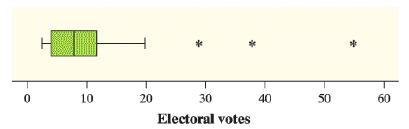
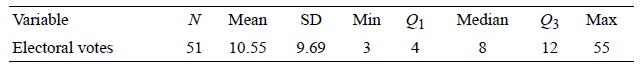
a. Explain why the median and IQR would be a better choice for summarizing the center and variability of the distribution of electoral votes than the mean and standard deviation.
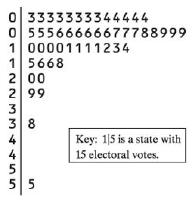
b. Identify an aspect of the distribution that the stemplot in Exercise 91 reveals that the boxplot does not.
Exercise 91.
To become president of the United States, a candidate does not have to receive a majority of the popular vote. The candidate does have to win a majority of the 538 Electoral College votes. Here is a stemplot of the number of electoral votes in 2016 for each of the 50 states and the District of Columbia:
10 20 30 40 50 60 Electoral votes
Step by Step Solution
3.41 Rating (160 Votes )
There are 3 Steps involved in it
a When there are no outliers in a sample the mean an... View full answer

Get step-by-step solutions from verified subject matter experts
Document Format (2 attachments)
2048_61d6ac3429875_836244.pdf
180 KBs PDF File
2048_61d6ac3429875_836244.docx
120 KBs Word File