

Question: We used Census At Schools Random Data Selector to choose a sample of 50 Canadian students who completed a survey in a recent year. Here
We used Census At School’s “Random Data Selector” to choose a sample of 50 Canadian students who completed a survey in a recent year. Here are the students’ heights (in centimeters):
Make an appropriate graph to display these data. Describe the shape, center, and variability of the distribution. Are there any outliers?
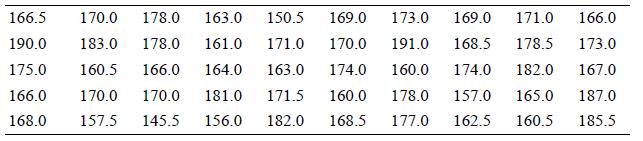
166.5 170.0 178.0 163.0 150.5 169.0 173.0 169.0 171.0 166.0 190.0 183.0 178.0 161.0 171.0 170.0 191.0 168.5 178.5 173.0 175.0 160.5 166.0 164.0 163.0 174.0 160.0 174.0 182.0 167.0 166.0 170.0 170.0 181.0 171.5 160.0 178.0 157.0 165.0 187.0 168.0 157.5 145.5 156.0 182.0 168.5 177.0 162.5 160.5 185.5
Step by Step Solution
3.45 Rating (158 Votes )
There are 3 Steps involved in it
Distribution of Data of Canadian students who completed a survey Summary Statistics Above Histogram ... View full answer

Get step-by-step solutions from verified subject matter experts