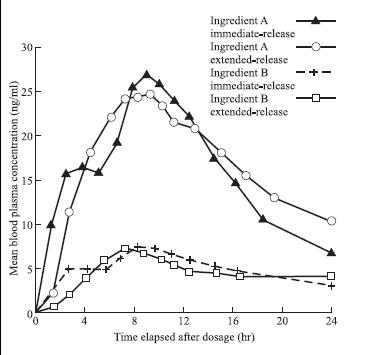
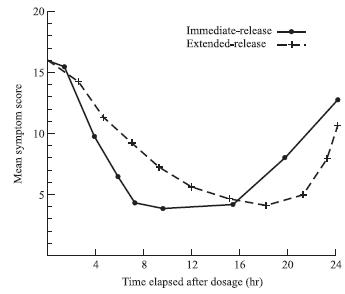
Based on the data in Figures 1 and 2, the researchers should make which of the following
Question:
Based on the data in Figures 1 and 2, the researchers should make which of the following conclusions about the overall change in mean blood plasma concentration and mean symptom score over time following dosage?


F. Both mean blood plasma concentration and mean symptom score increase then decrease.
G. Both mean blood plasma concentration and mean symptom score decrease then increase.
H. Mean blood plasma concentration increases then decreases, and mean symptom score decreases then increases.
J. Mean blood plasma concentration decreases then increases, and mean symptom score increases then decreases.
Fantastic news! We've Found the answer you've been seeking!
Step by Step Answer:
Related Book For 

Question Posted:


