

1. The table below shows the age of each employee at a cardboard box factory. Based on...
Question:
1. The table below shows the age of each employee at a cardboard box factory.
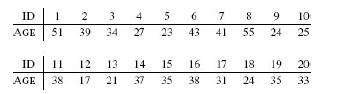
Based on this data calculate the following summary statistics for the AGE feature:
a. Minimum, maximum and range
b. Mean and median
c. Variance and standard deviation
d. 1st quartile (25th percentile) and 3rd quartile (75th percentile)
e. Inter-quartile range
f. 12th percentile
Fantastic news! We've Found the answer you've been seeking!
Step by Step Answer:

Answered By
OTIENO OBADO
I have a vast experience in teaching, mentoring and tutoring. I handle student concerns diligently and my academic background is undeniably aesthetic
3+ Reviews
10+ Question Solved
Related Book For 

Fundamentals Of Machine Learning For Predictive Data Analytics Algorithms Worked Examples And Case Studies
ISBN: 9780262029445
1st Edition
Authors: John D. Kelleher, Brian Mac Namee, Aoife D'Arcy
Question Posted:
