

Question: 3. A credit card issuer has built two different credit scoring models that predict the propensity of customers to default on their loans. The outputs
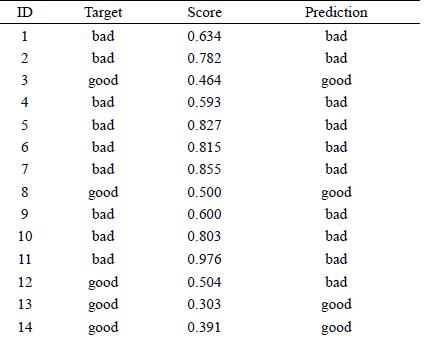
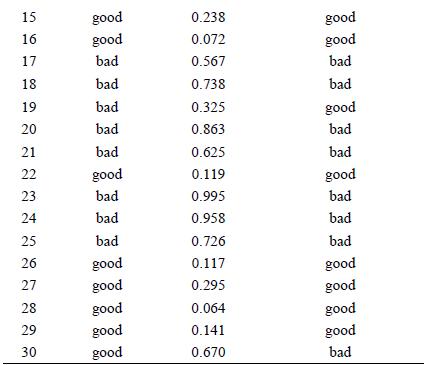
3. A credit card issuer has built two different credit scoring models that predict the propensity of customers to default on their loans. The outputs of the first model for a test dataset are shown in the table below.
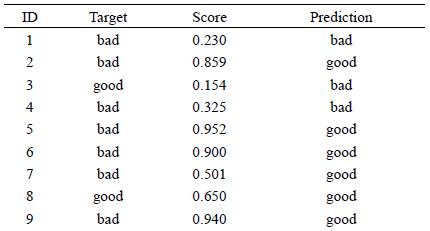
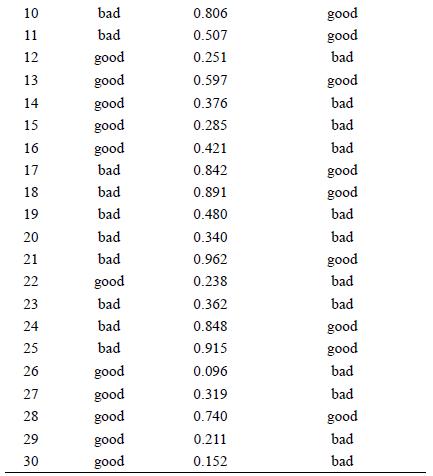
The outputs of the second model for the same test dataset are shown in the table below.
Based on the predictions of these models, perform the following tasks to compare their performance.
a. The image below shows an ROC curve for each model. Each curve has a point missing.
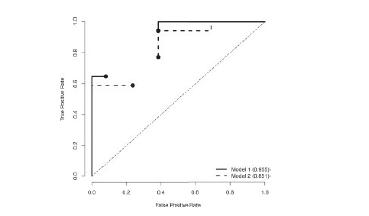
Calculate the missing point in the ROC curves for Model 1 and Model 2. To generate the point for Model 1, use a threshold value of 0.51. To generate the point for Model 2, use a threshold value of 0.43.
b. The area under the ROC curve (AUC) for Model 1 is 0.955 and for Model 2 is 0.851. Which model is performing best?
c. Based on the AUC values for Model 1 and Model 2, calculate the Gini coefficient for each model.
ID Target Score Prediction 123 4 567891 bad 0.634 bad bad 0.782 bad good 0.464 good bad 0.593 bad bad 0.827 bad bad 0.815 bad bad 0.855 bad good 0.500 good bad 0.600 bad 10 bad 0.803 bad 11 bad 0.976 bad 12 good 0.504 bad 13 good 0.303 good 14 good 0.391 good
Step by Step Solution
There are 3 Steps involved in it

Get step-by-step solutions from verified subject matter experts