

Question: 4. A retail supermarket chain has built a prediction model that recognizes the household that a customer comes from as being one of single, business,
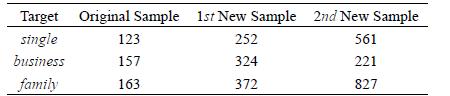
4. A retail supermarket chain has built a prediction model that recognizes the household that a customer comes from as being one of single, business, or family. After deployment, the analytics team at the supermarket chain uses the stability index to monitor the performance of this model. The table below shows the frequencies of predictions of the three different levels made by the model for the original validation dataset at the time the model was built, for the month after deployment, and for a month-long period six months after deployment.
Bar plots of these three sets of prediction frequencies are shown in the following images.
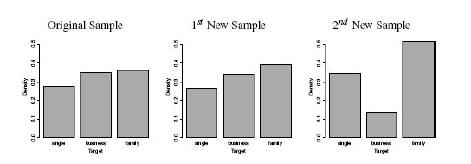
Calculate the stability index for the two new periods and determine whether the model should be retrained at either of these points.
Target Original Sample 1st New Sample 2nd New Sample single 123 252 561 business 157 324 221 family 163 372 827
Step by Step Solution
There are 3 Steps involved in it

Get step-by-step solutions from verified subject matter experts