

Question: Using the results given in Table 2.1 for the Fourier coefficients of a pulse train, plot the double-sided amplitude and phase spectra for the wave
Using the results given in Table 2.1 for the Fourier coefficients of a pulse train, plot the double-sided amplitude and phase spectra for the wave forms shown in Figure 2.34.
(Note that xb(t) = -xa(t) + A.
How is a sign change and DC level shift manifested in the spectrum of the waveform?)
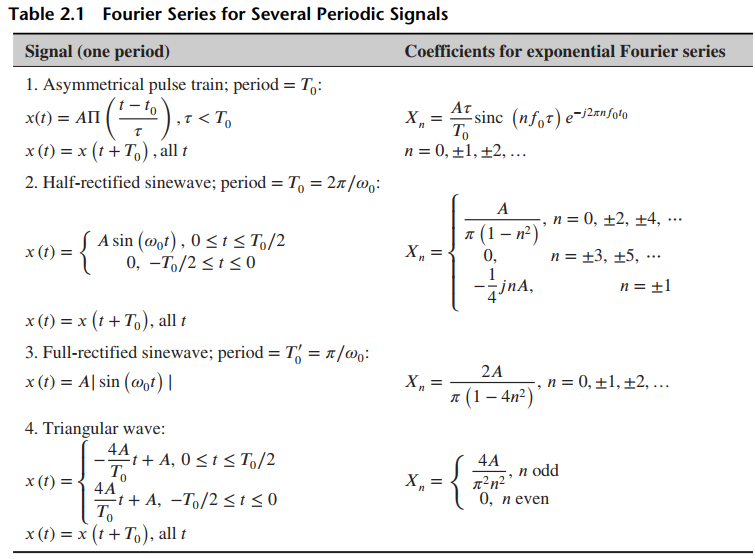
Figure 2.34
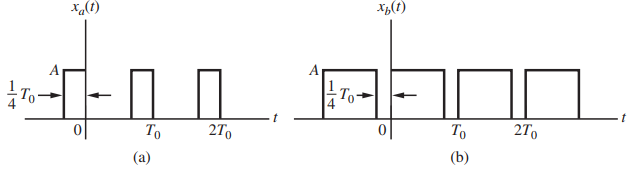
Table 2.1 Fourier Series for Several Periodic Signals Signal (one period) Coefficients for exponential Fourier series 1. Asymmetrical pulse train; period = T,: (-).-
Step by Step Solution
3.43 Rating (172 Votes )
There are 3 Steps involved in it
a In the expression for the Fourier series of a pulse trai... View full answer

Get step-by-step solutions from verified subject matter experts