

The following diagram represents the hypothetical results of a study of the behavior of the stock prices
Question:
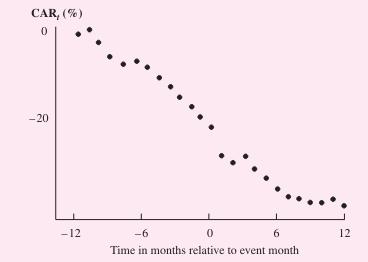
The following diagram represents the hypothetical results of a study of the behavior of the stock prices of firms that lost antitrust cases. Included are all firms that lost the initial court decision, even if it was later overturned on appeal. Is the diagram consistent with market efficiency? Why or why not.?
Fantastic news! We've Found the answer you've been seeking!
Step by Step Answer:

Answered By
PALASH JHANWAR
I am a Chartered Accountant with AIR 45 in CA - IPCC. I am a Merit Holder ( B.Com ). The following is my educational details.
PLEASE ACCESS MY RESUME FROM THE FOLLOWING LINK: https://drive.google.com/file/d/1hYR1uch-ff6MRC_cDB07K6VqY9kQ3SFL/view?usp=sharing
3+ Reviews
10+ Question Solved
Related Book For 

Question Posted:
