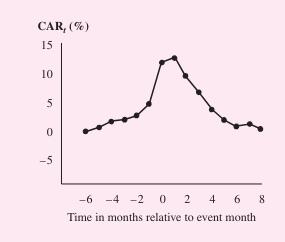
The following diagram shows the cumulative abnormal returns on the stock prices of 386 oil- and gas-exploration
Question:
The following diagram shows the cumulative abnormal returns on the stock prices of 386 oil- and gas-exploration companies that announced oil discoveries in month 0. The sample was drawn from 1950 to 1980, and no single month had more than six announcements. Is the diagram consistent with market efficiency? Why or why not?

Fantastic news! We've Found the answer you've been seeking!
Step by Step Answer:
Related Book For 

Question Posted:


